

beorach
-
Posts
803 -
Joined
-
Last visited
Content Type
Profiles
Forums
Events
Articles
Media Demo
Posts posted by beorach
-
-
The 2018 stats have conference championship games figured in but that's about the only difference and didn't likely make much of one besides. I personally wonder how much of a difference Stanley Morgan made in looking at some of these figures. The numbers are percentile ratings of the stats from now (given first) and then (2018 season).
PASSING DEFENSE
comp/g: 86 in 2019 to 30 in 2018
pct: 61 to 81
yds/att: 86 to 71
td/g: 83 to 70
qb rating: 79 to 76
yds/g: 93 to 34
PASSING OFFENSE
comp/g: 32 to 79
pct: 53 to 79
yds/att: 46 to 50
td/g: 14 to 47
qb rating: 37 to 58
yds/g: 30 to 70
RUSHING DEFENSE
yds/att: 5 to 10
td/g: 14 to 9
yds/g: 9 to 16
RUSHING OFFENSE
yds/att: 64 to 87
td/g: 71 to 70
yds/g: 81 to 68
SCORING DEFENSE
td/g: 39 to 24
pts/g: 38 to 21
SCORING OFFENSE
td/g: 37 to 56
pts/g: 37 to 60
TOTAL DEFENSE
plays/g: 52 to 49
yds/play: 39 to 30
yds/g: 53 to 15
TOTAL OFFENSE
plays/g: 83 to 63
yds/play: 43 to 80
yds/g: 59 to 82
TURNOVER MARGIN
fg/g: 58 to 64
ig/g: 34 to 55
tg/g: 43 to 63
fl/g: 28 to 23
il/g: 53 to 68
tl/g: 38 to 47
margin/g: 37 to 57
GBR !
-
 2
2
-
 1
1
-
-
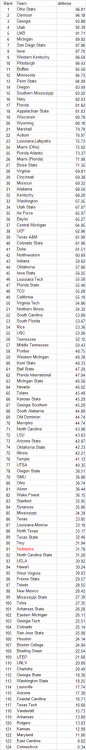
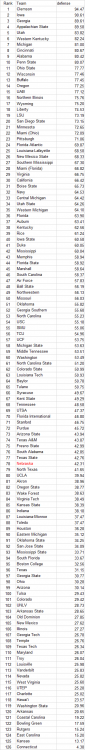
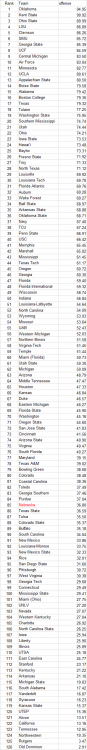
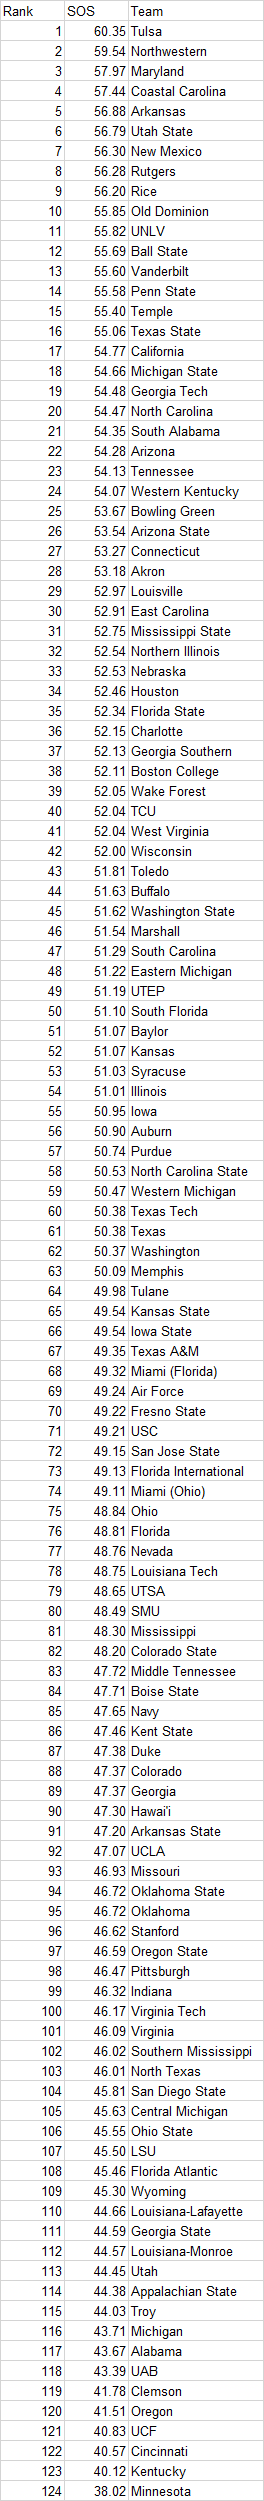
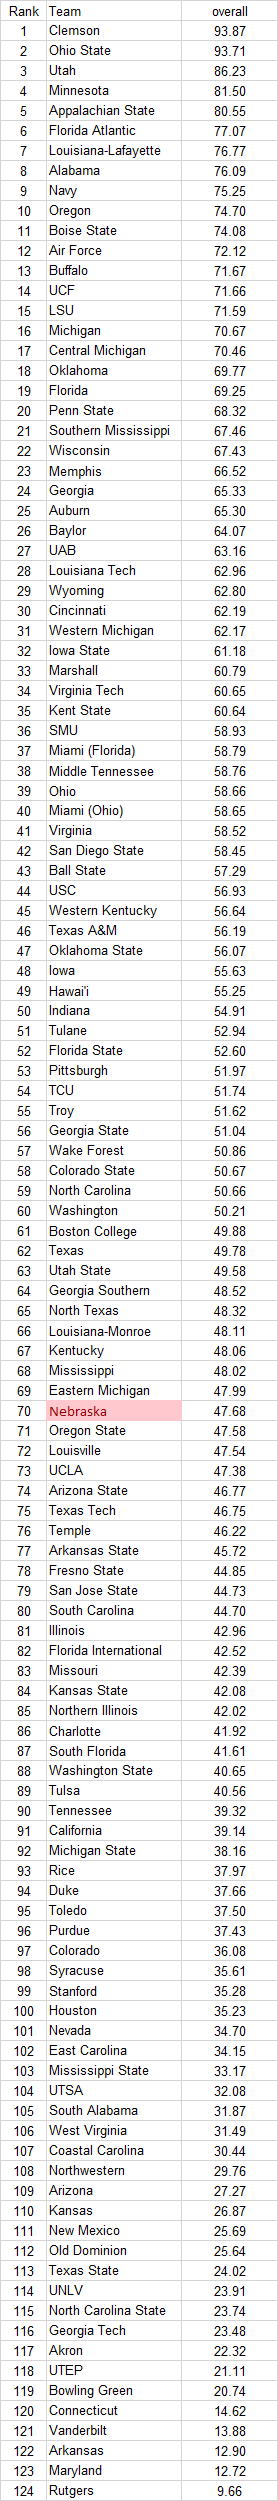
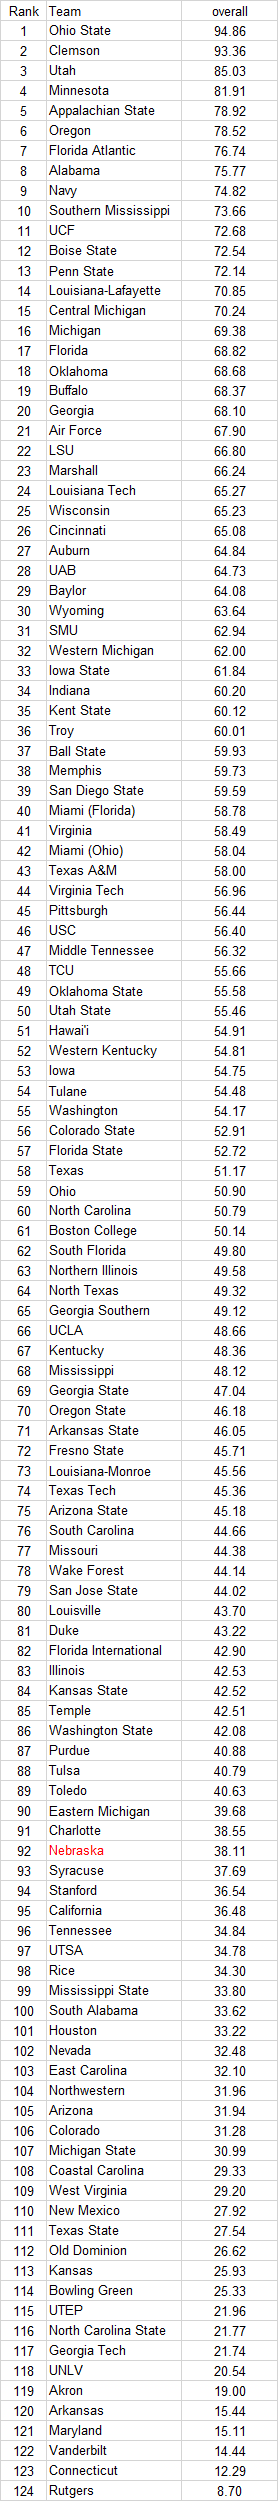
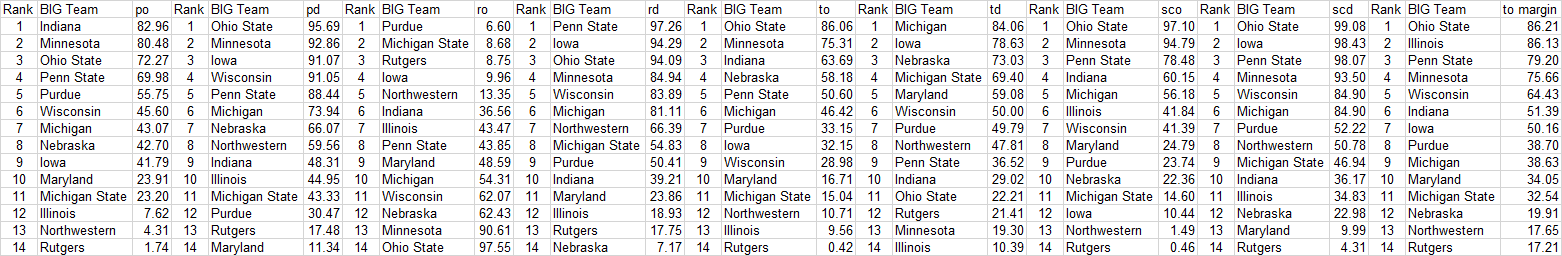
Based on the average stats of the teams they faced (calculated by taking the average of their opponents' overall percentile rankings correlating to what I share weekly in the nat'l rankings post), these are the SOS rankings for all the FBS conference teams (and, as usual, in fine print you have to click on to enlarge in a separate tab to read):
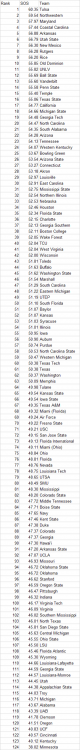
p.s. - On the plus side, we've played a tougher schedule than Iowa per my very basic calculation here.
p.p.s. - I should have mentioned before that this only takes into consideration what games have been played to date. Michigan will certainly move up with their game against the Buckeyes, for example. Minnesota will likely do the same for playing Wisconsin. Etc.
GBR !
-
2
-
-
I don't care about the trophies so much as not allowing the streak Iowa has to continue.
Does anyone else remember the Iron Bowl t-shirts Auburn wore back when they had lost to Alabama four games in a row?
I distinctly remember some tiger on them with a caption of, "Stop the Thumb."
I admire the level of commitment to drama and football alike in those parts of our country.
-
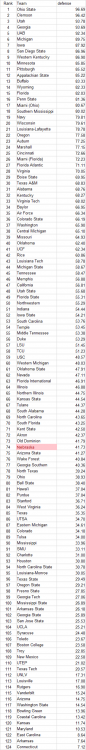
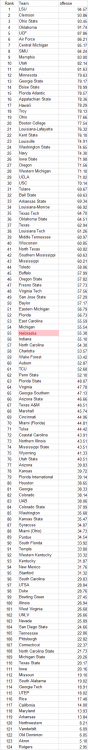
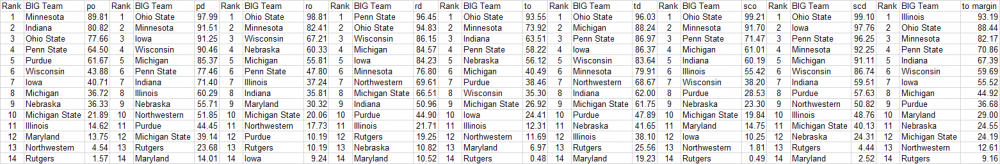
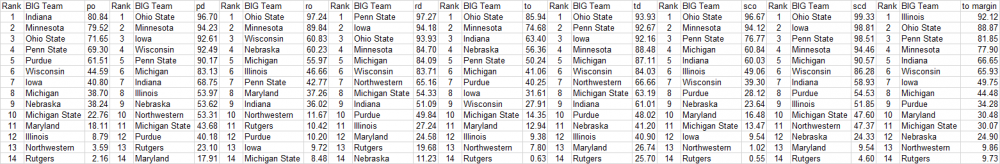
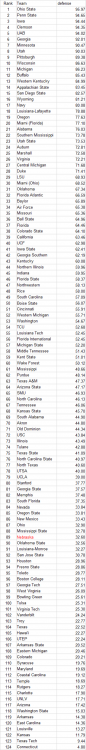
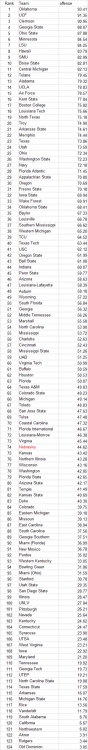
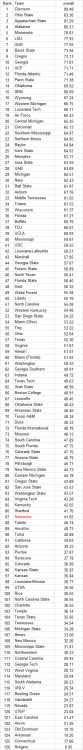
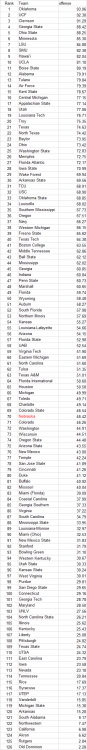
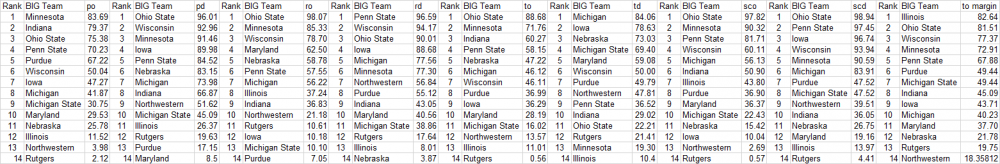
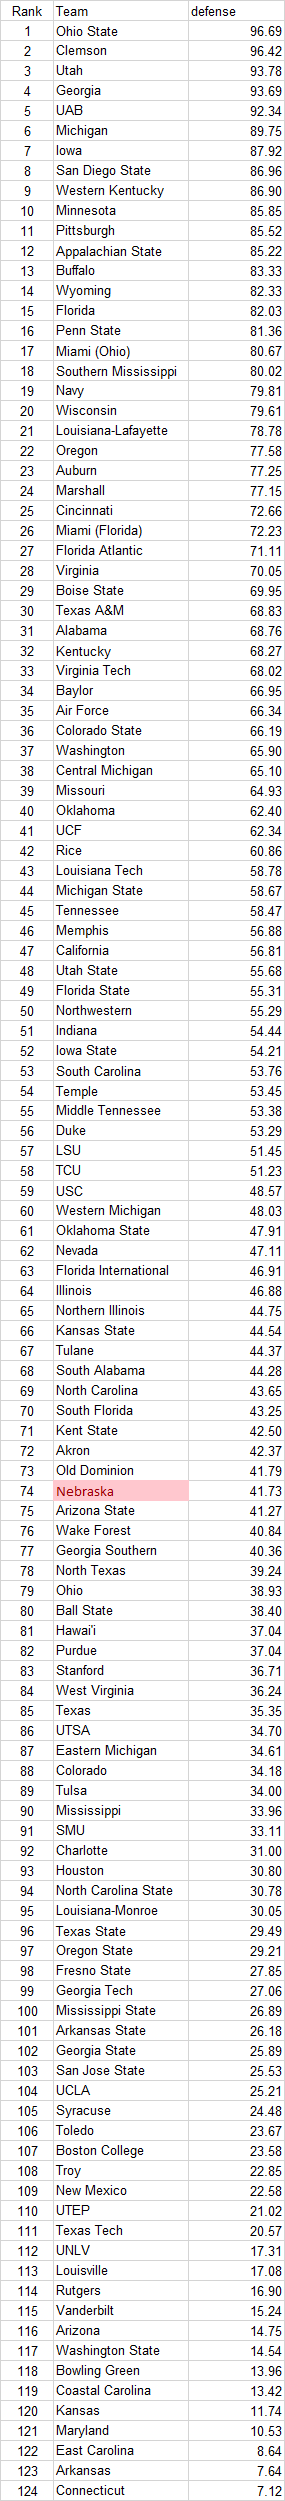
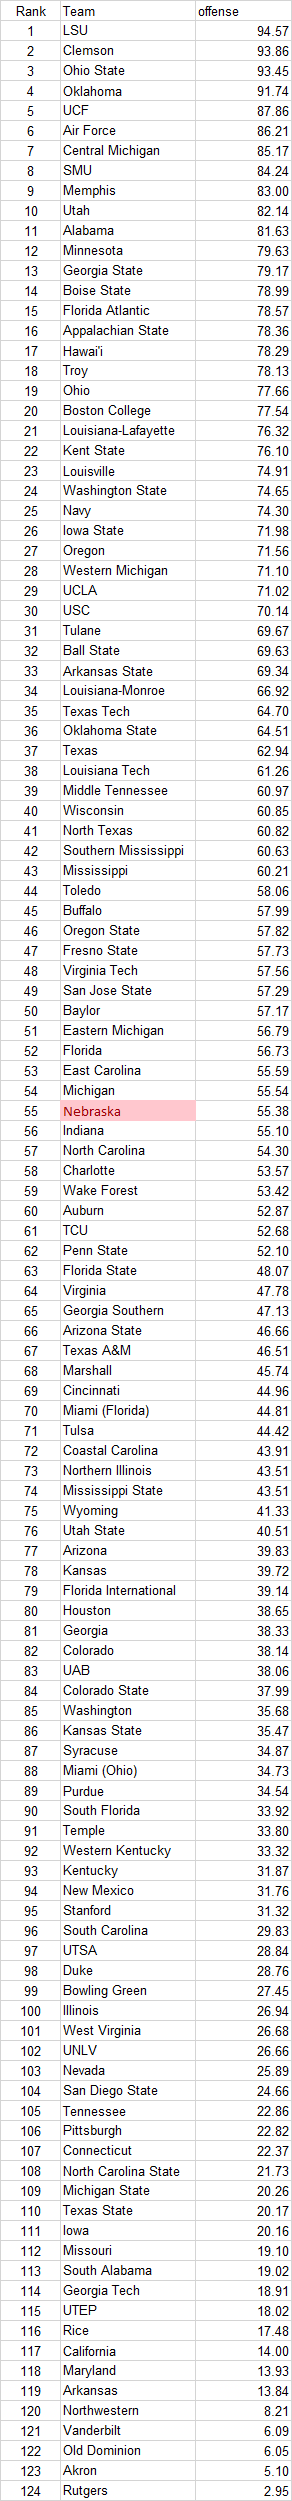
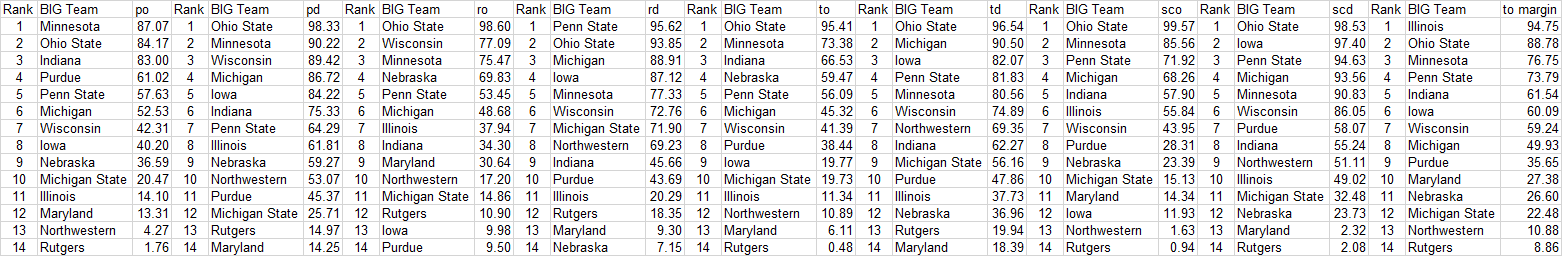
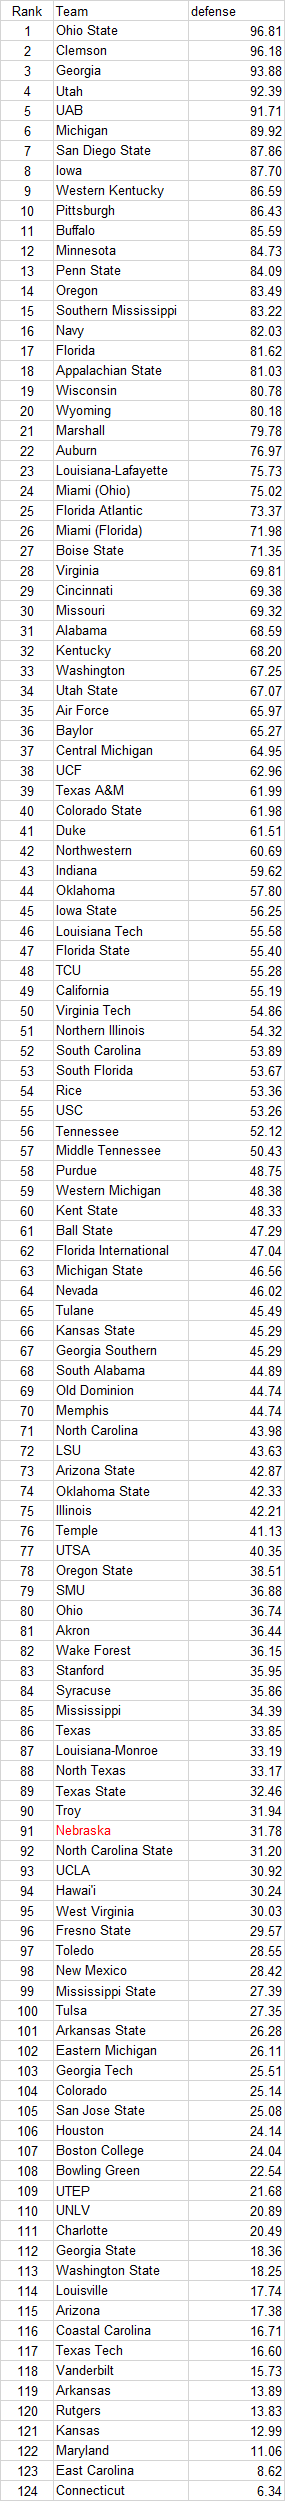
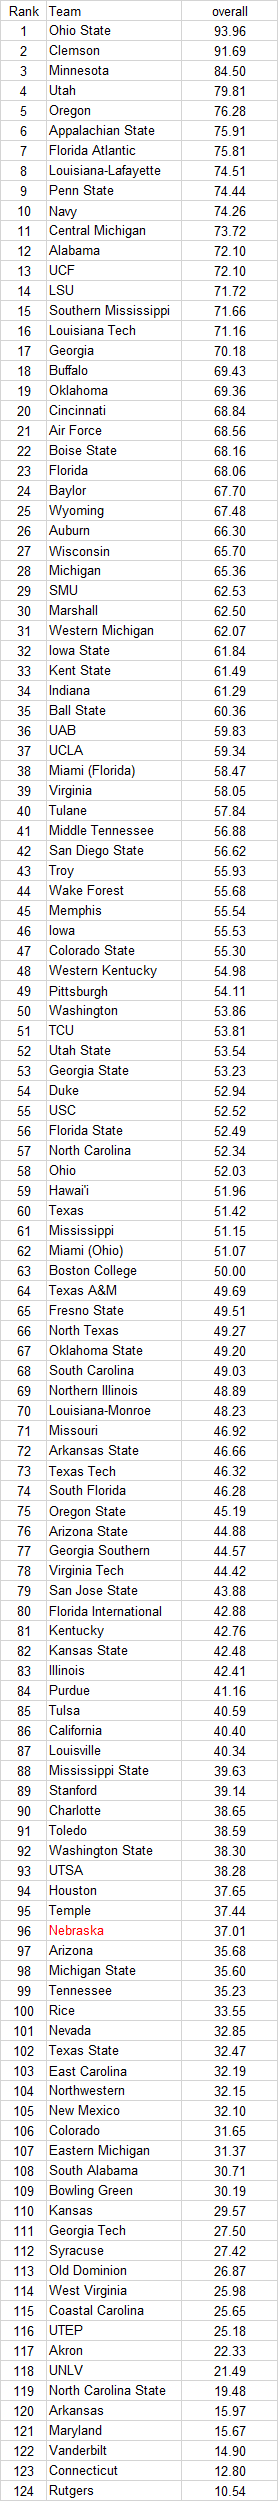
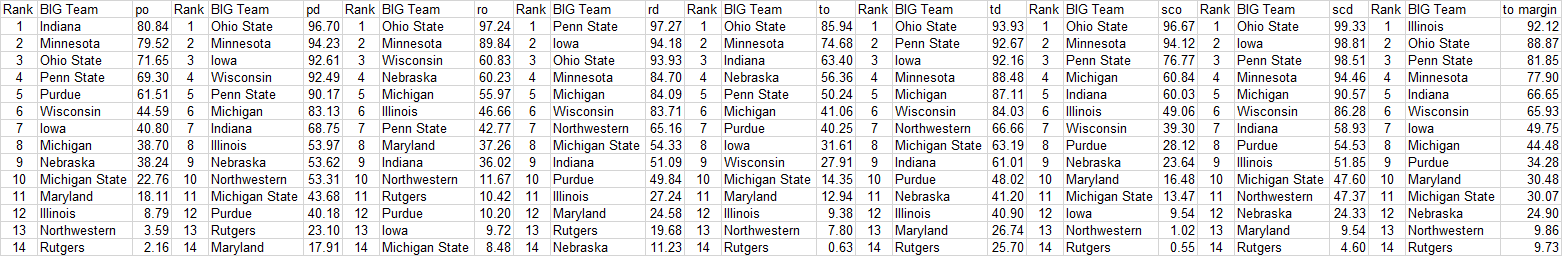
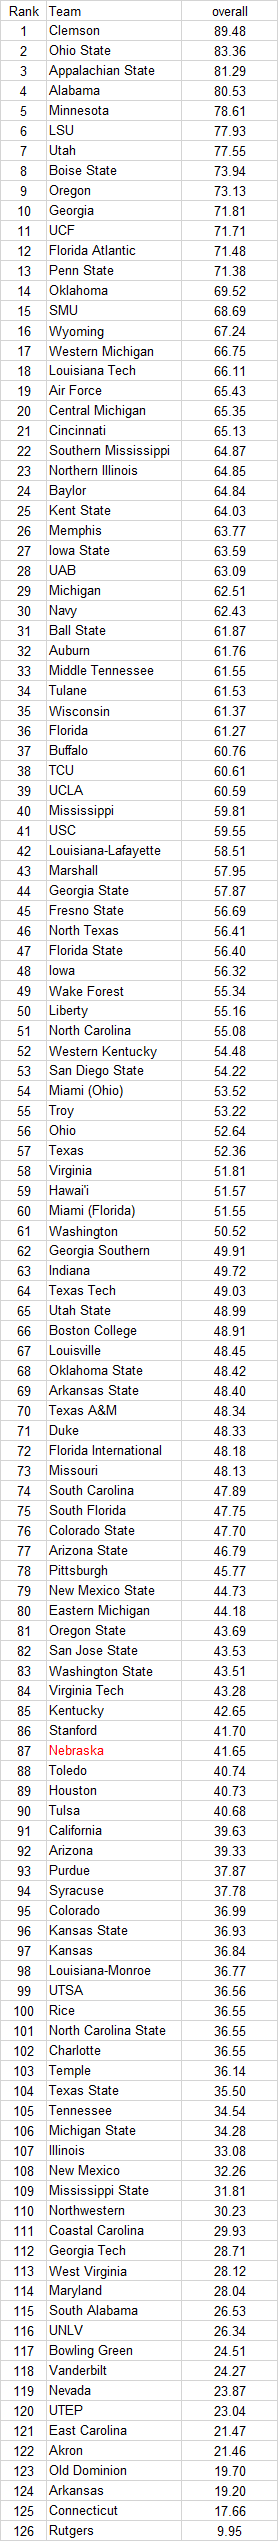
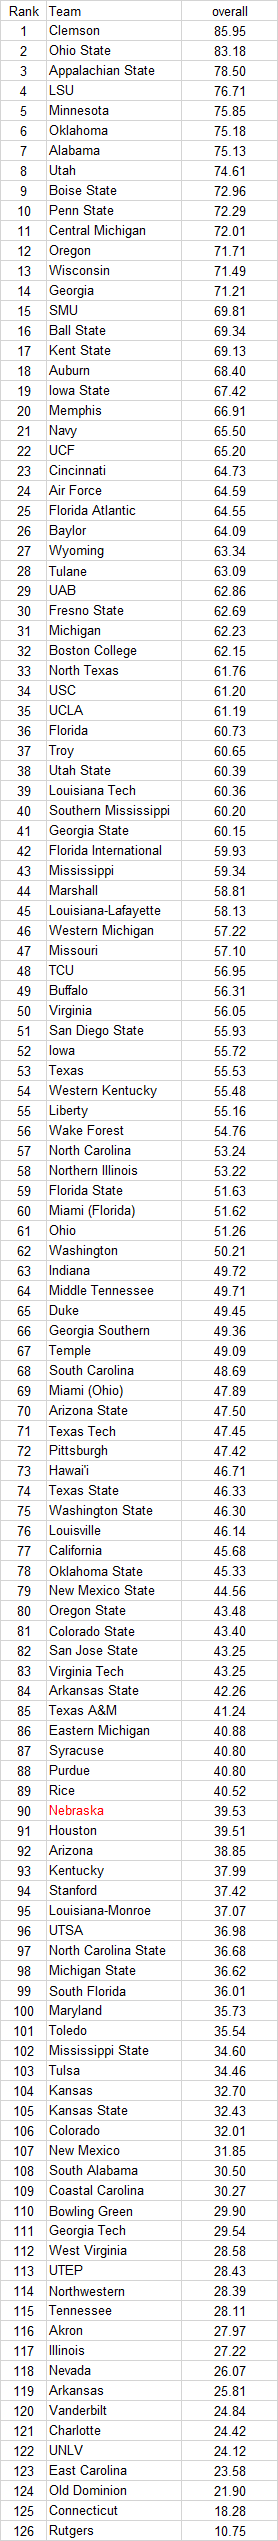
The numbers are averages of average percentiles for figures from the following statistical categories (as appropriate): pass d/o; rush d/o; scoring d/o; total d/o; and turnover margin. You can click on the data cells pasted below a couple of times to make them more legible but I think it opens up another tab in your browser in my experience, at least. You get what you pay for, I guess, but I'll take any free advice as to how I might be using the board wrong also.
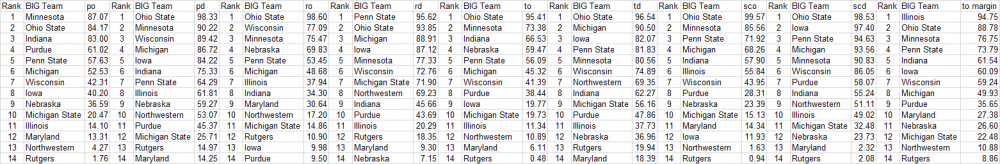
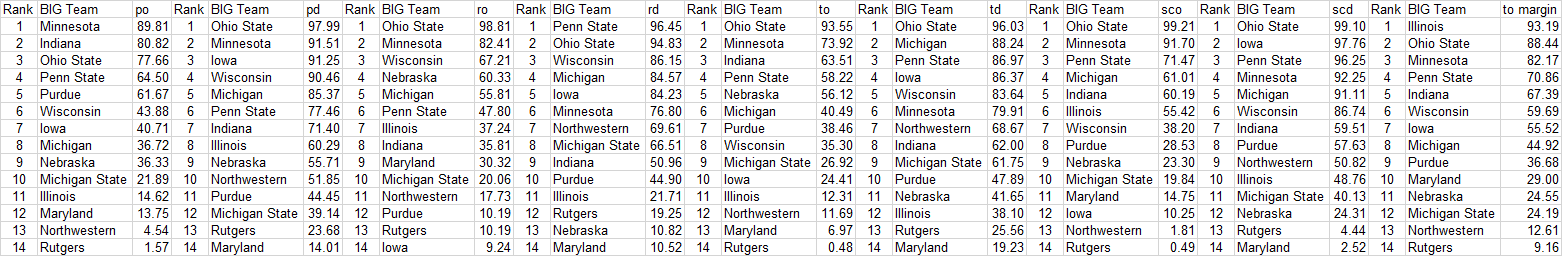
B1G
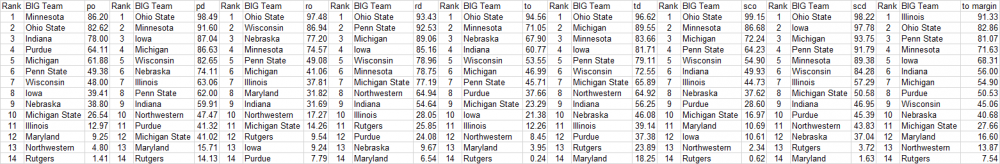
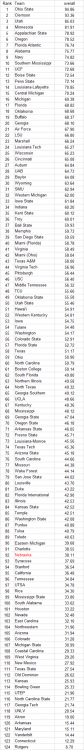
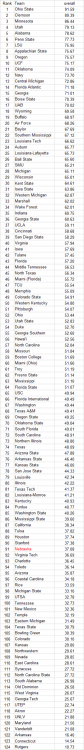
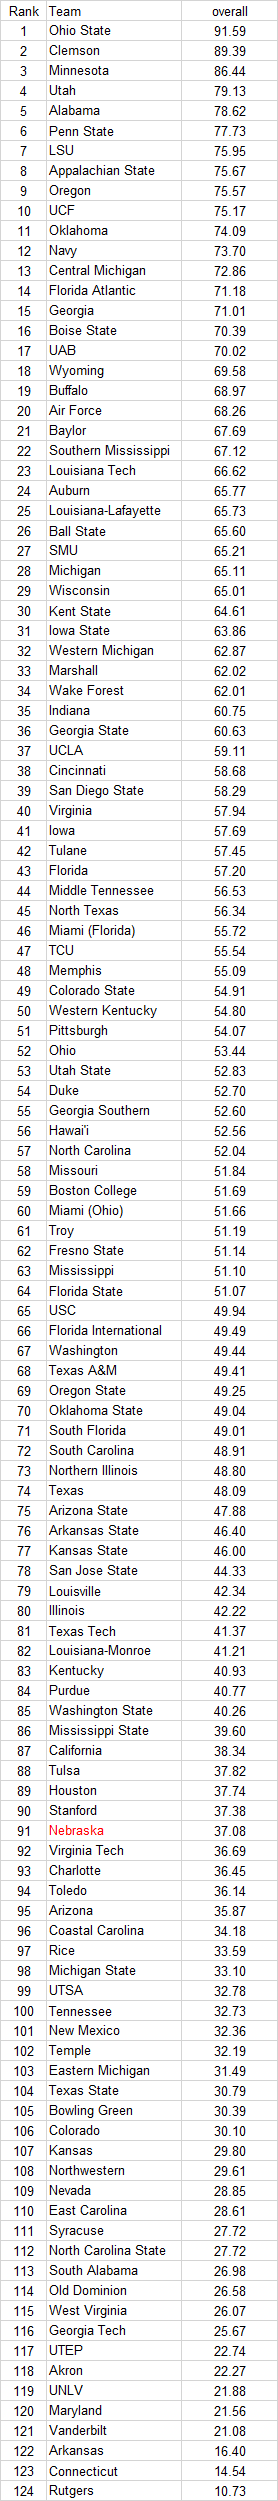
Overall National Rankings
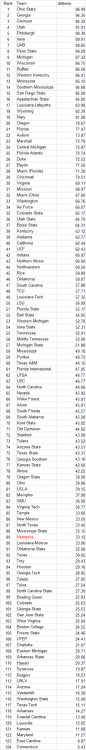
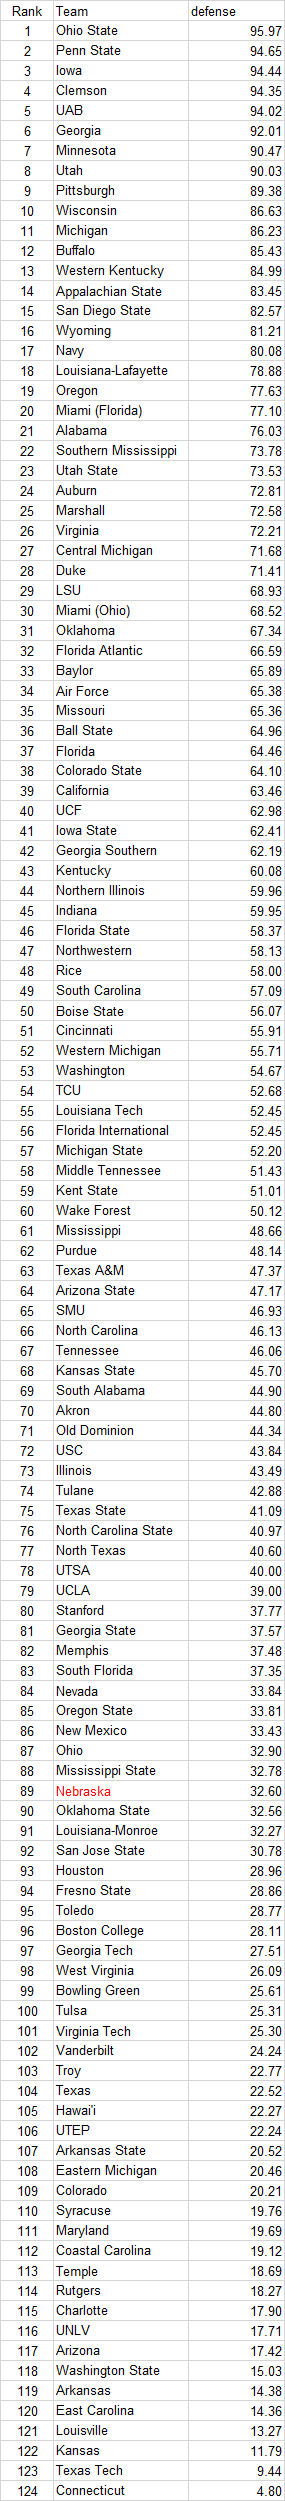
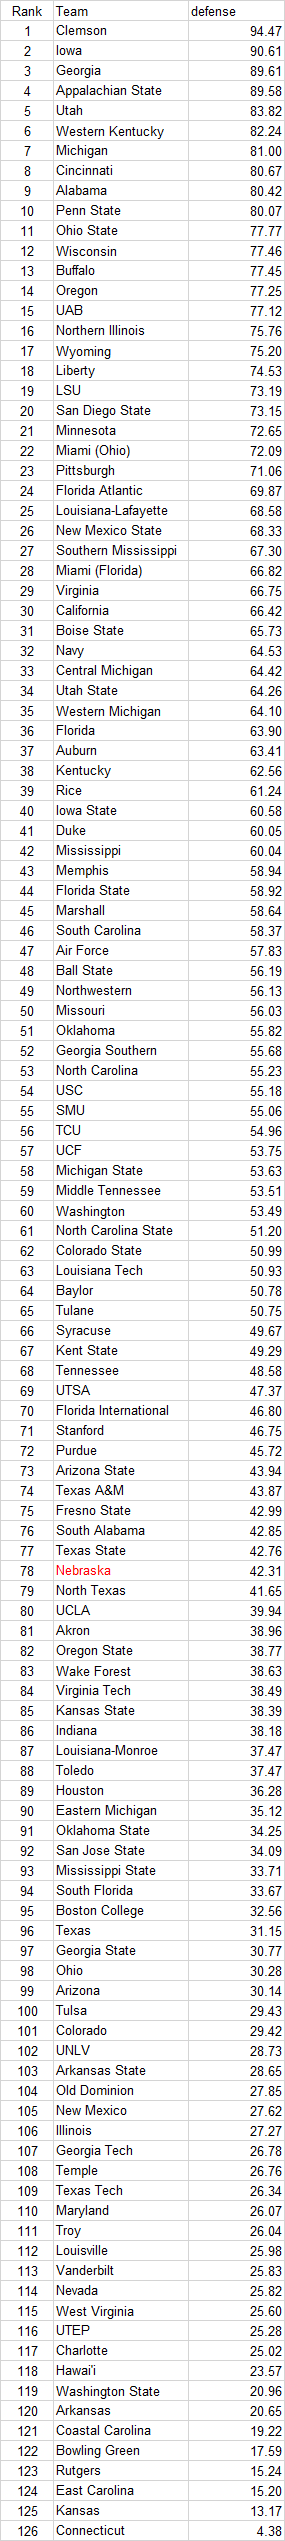
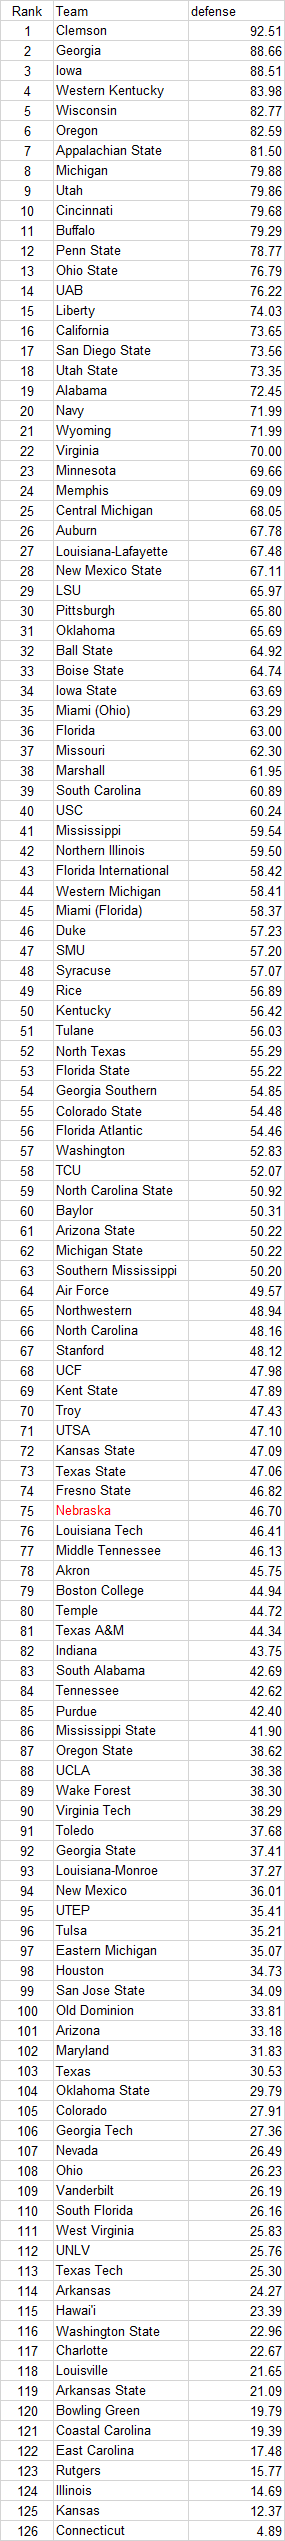
Overall Defensive Rankings
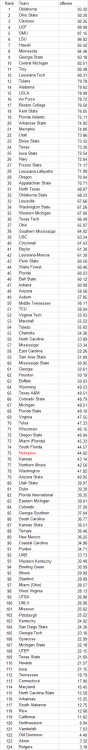
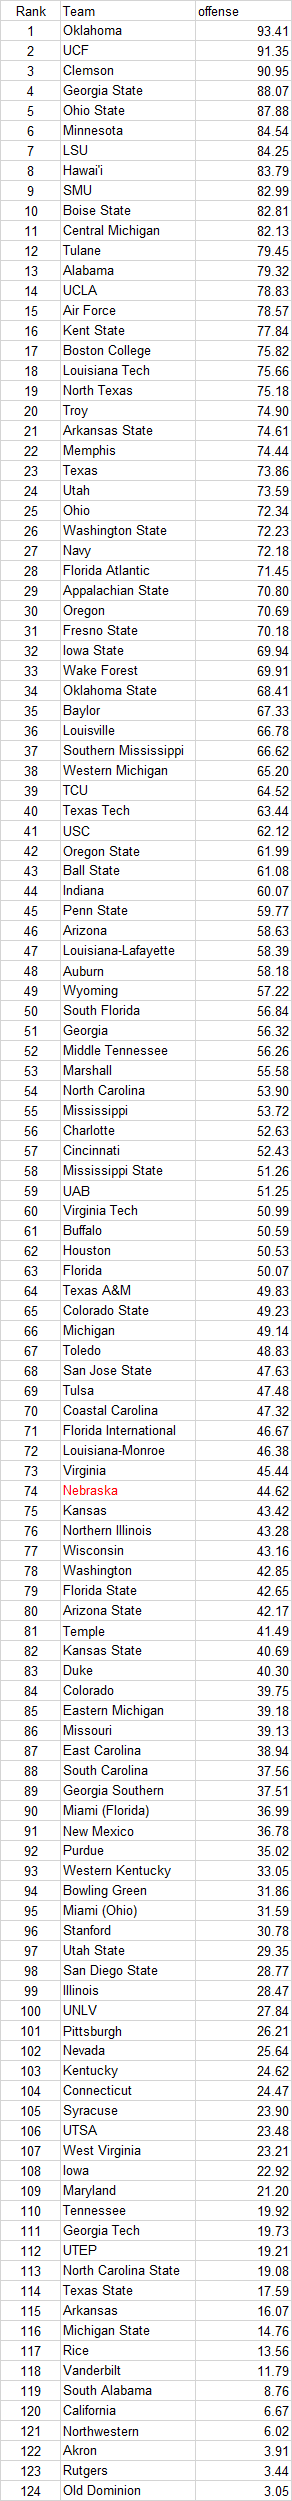
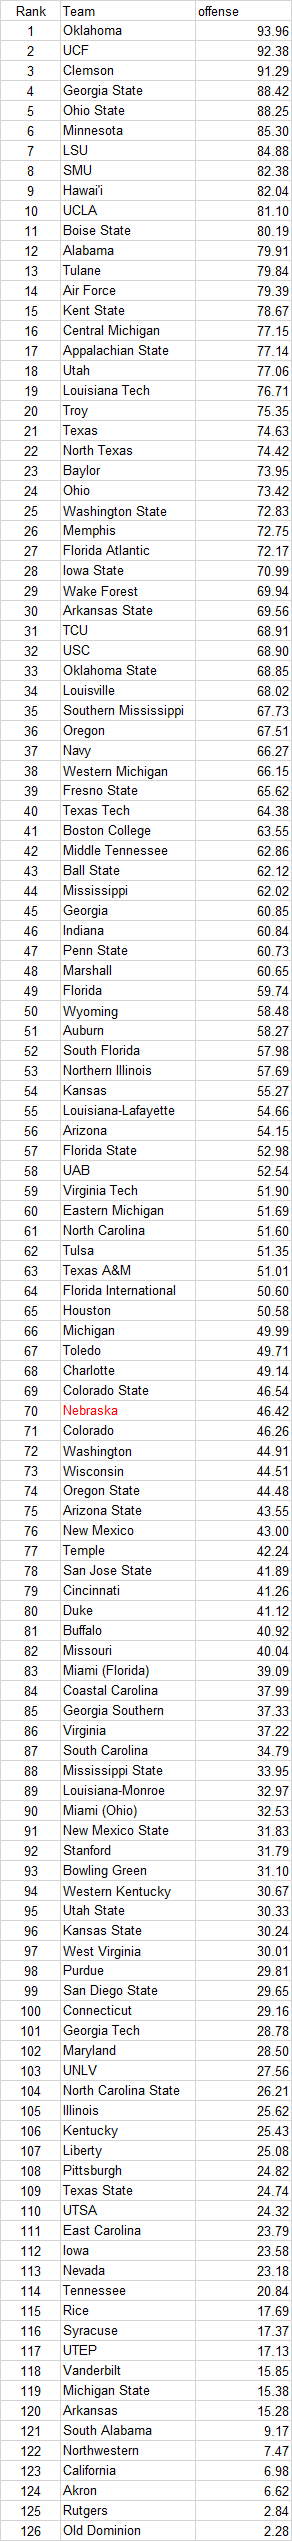
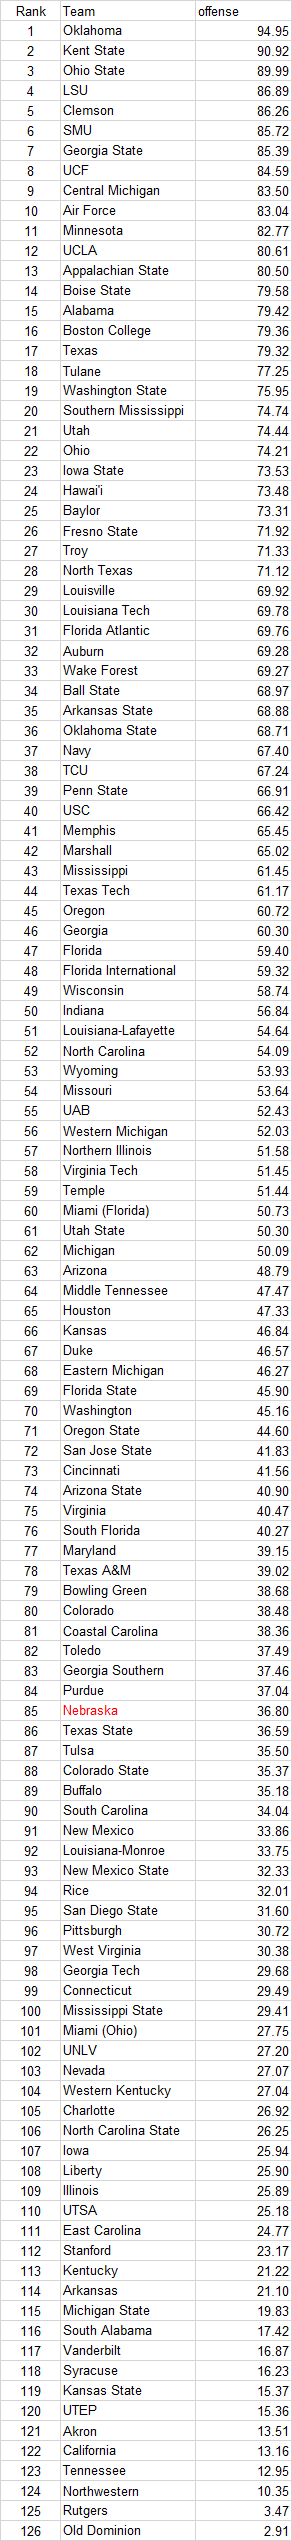
Overall Offensive Rankings
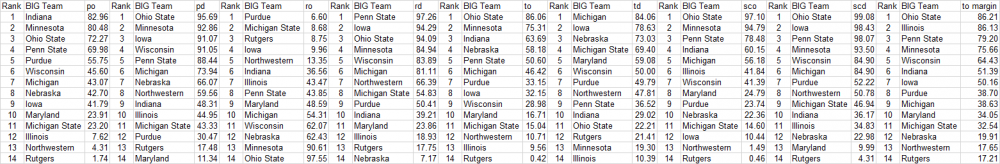
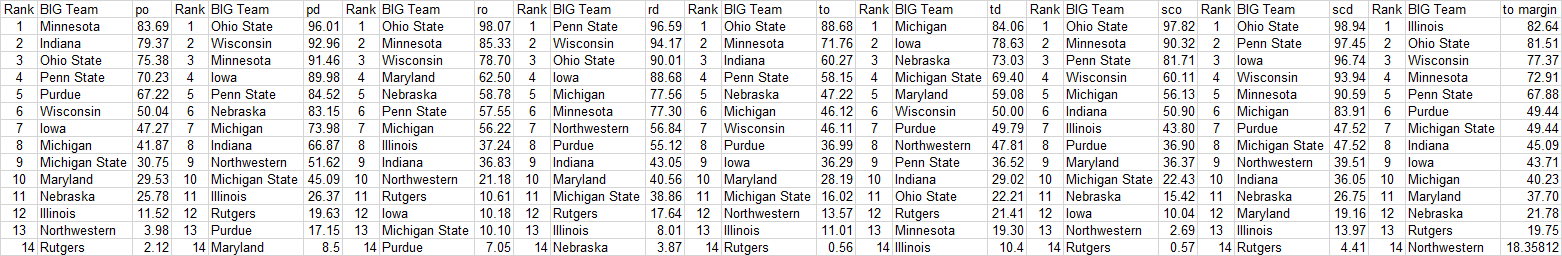
Conference Rankings

The conference rankings are the average of the averages for the stats in the categories listed for all the conference teams in a particular conference.
GBR !
-
1
-
-
Just like every week, I'm only considering stats from conference games. The numbers are percentile rankings (such that 100 is the best rating you can get and 0 the worst). No adjustment has been made to reflect strength of schedule differences.
NU vs. Iowa
Passing Defense
completions allowed per game: 80 (NU) to 61 (Hawkeyes)
completion percentage allowed: 48 to 80
yards per attempt allowed: 77 to 95
touchdowns per game allowed: 76 to 90
qb rating allowed: 67 to 94
yards per game allowed: 89 to 87
Passing Offense
completions per game: 35 to 52
completion percentage: 59 to 34
yards per attempt: 53 to 43
touchdowns per game: 14 to 23
qb rating: 42 to 33
yards per game: 37 to 54
Rushing Defense
yards per game allowed: 10 to 80
touchdowns per game allowed: 13 to 94
yards per carry allowed: 7 to 76
Rushing Offense
yards per game: 82 to 11
touchdowns per game: 77 to 9
yards per carry: 72 to 8
Scoring Defense
touchdowns per game allowed: 37 to 98
points per game allowed: 37 to 98
Scoring Offense
touchdowns per game: 38 to 7
points per game: 38 to 15
Total Defense
yards per play allowed: 39 to 91
yards per game allowed: 48 to 91
plays per game allowed: 51 to 51
Total Offense:
yards per play: 56 to 25
yards per game: 67 to 19
plays per game: 79 to 21
Turnover Margin
fumbles gained per game: 52 to 36
interceptions gained per game: 31 to 83
turnovers gained per game: 36 to 69
fumbles lost per game: 33 to 77
interceptions lost per game: 56 to 56
turnovers lost per game: 42 to 73
turnover margin per game: 36 to 77
GBR!
-
2
-
-
3 hours ago, NUance said:

Jinkies! I think there's some writing there!
Congrats on being the latest Husker fan to crack on the presentation of my calculations' results (likely without reading what I wrote about it)!
p.s. - Can someone help me out with a .gif depicting a deceased horse, in an open box resting on discarded gift wrapping paper, being subjected to both an oral inspection and a savage beating?
-
 1
1
-
-
The numbers are averages of average percentiles for figures from the following statistical categories (as appropriate): pass d/o; rush d/o; scoring d/o; total d/o; and turnover margin. You can click on the data cells pasted below a couple of times to make them more legible but I think it opens up another tab in your browser in my experience, at least. You get what you pay for, I guess, but I'll take any free advice as to how I might be using the board wrong also.
B1G
Overall National Rankings
Overall Defensive Rankings
Overall Offensive Rankings
Conference Rankings

The conference rankings are the average of the averages for the stats in the categories listed for all the conference teams in a particular conference.
GBR !
-
4
-
-
Just like every week, I'm only considering stats from conference games. The numbers are percentile rankings (such that 100 is the best rating you can get and 0 the worst). No adjustment has been made to reflect strength of schedule differences.
NU vs. MD
Passing Defense
completions allowed per game: 66 (NU) to 10 (Terps)
completion percentage allowed: 29 to 9
yards per attempt allowed: 63 to 18
touchdowns per game allowed: 65 to 23
qb rating allowed: 51 to 15
yards per game allowed: 79 to 12
Passing Offense
completions per game: 32 to 18
completion percentage: 56 to 15
yards per attempt: 55 to 13
touchdowns per game: 11 to 15
qb rating: 39 to 9
yards per game: 36 to 11
Rushing Defense
yards per game allowed: 7 to 13
touchdowns per game allowed: 9 to 3
yards per carry allowed: 6 to 18
Rushing Offense
yards per game: 76 to 25
touchdowns per game: 66 to 32
yards per carry: 67 to 36
Scoring Defense
touchdowns per game allowed: 24 to 2
points per game allowed: 23 to 2
Scoring Offense
touchdowns per game: 26 to 19
points per game: 21 to 11
Total Defense
yards per play allowed: 29 to 15
yards per game allowed: 32 to 6
plays per game allowed: 51 to 47
Total Offense:
yards per play: 55 to 15
yards per game: 60 to 5
plays per game: 64 to 2
Turnover Margin
fumbles gained per game: 9 to 17
interceptions gained per game: 41 to 41
turnovers gained per game: 14 to 21
fumbles lost per game: 22 to 72
interceptions lost per game: 61 to 10
turnovers lost per game: 38 to 28
turnover margin per game: 18 to 18
GBR!
-
2
-
-
They're all percentiles. Wisconsin has 7 passing TD's in conference play while Nebraska has 4.
I average percentile scores in my other weekly post devoted to all conference teams and the P5 conferences themselves in FBS.
p.s. - The fumbling is what surprised me last year when I bet Wisconsin against Northwestern and they took Taylor out at half because he had at least three or so... Hornibrook was diagnosed (or suffered) with a concussion after I placed that one, too. I'd like to see another ugly game from them this weekend but don't suppose we get that lucky.
-
1
-
1
-
-
2 hours ago, Huckleberry Muhammad said:
Thank you for those stats, beorach.
Thanks for the appreciation!
-
1
-
1
-
-
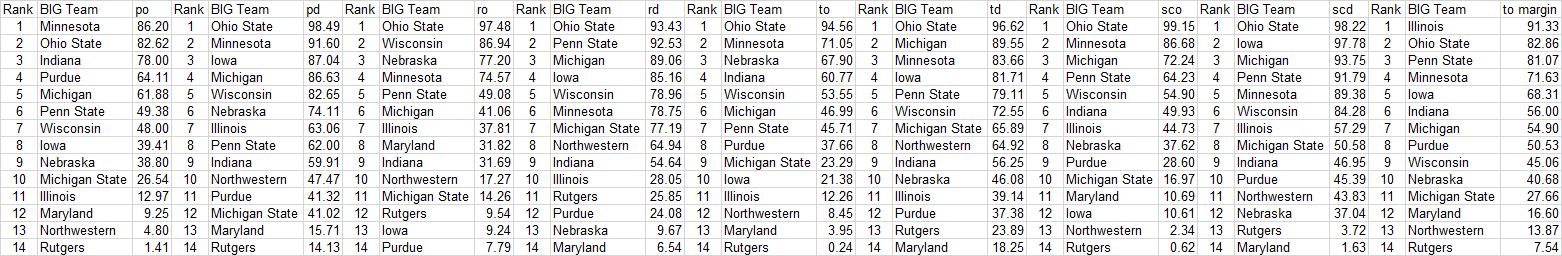
The numbers are averages of average percentiles for figures from the following statistical categories (as appropriate): pass d/o; rush d/o; scoring d/o; total d/o; and turnover margin. You can click on the data cells pasted below a couple of times to make them more legible but I think it opens up another tab in your browser in my experience, at least. You get what you pay for, I guess, but I'll take any free advice as to how I might be using the board wrong also.
B1G
Considering we're 4th in RO and fifth in TO, it sort of speaks to how we've managed to move the ball and just don't have much to show for it.
Overall National Rankings
Overall Defensive Rankings
Overall Offensive Rankings
Conference Rankings

The conference rankings are the average of the averages for the stats in the categories listed for all the conference teams in a particular conference.
GBR !
-
2
-
-
6 minutes ago, Maized & Confused said:
I'm confused yet again. Do we get to play Purdue for a rematch?
Fixed - thanks
-
Just like every week, I'm only considering stats from conference games. The numbers are percentile rankings (such that 100 is the best rating you can get and 0 the worst). No adjustment has been made to reflect strength of schedule differences.
NU vs. UW
Passing Defense
completions allowed per game: 56 (NU) to 92 (Ferocious Animals)
completion percentage allowed: 27 to 99
yards per attempt allowed: 65 to 91
touchdowns per game allowed: 59 to 59
qb rating allowed: 52 to 92
yards per game allowed: 74 to 86
Passing Offense
completions per game: 37 to 30
completion percentage: 59 to 97
yards per attempt: 50 to 42
touchdowns per game: 10 to 14
qb rating: 37 to 56
yards per game: 36 to 13
Rushing Defense
yards per game allowed: 13 to 88
touchdowns per game allowed: 8 to 87
yards per carry allowed: 12 to 83
Rushing Offense
yards per game: 67 to 76
touchdowns per game: 63 to 56
yards per carry: 50 to 69
Scoring Defense
touchdowns per game allowed: 23 to 86
points per game allowed: 26 to 88
Scoring Offense
touchdowns per game: 25 to 39
points per game: 22 to 37
Total Defense
yards per play allowed: 36 to 90
yards per game allowed: 37 to 94
plays per game allowed: 51 to 56
Total Offense:
yards per play: 40 to 43
yards per game: 52 to 35
plays per game: 74 to 29
Turnover Margin
fumbles gained per game: 5 to 84
interceptions gained per game: 53 to 53
turnovers gained per game: 15 to 77
fumbles lost per game: 12 to 12
interceptions lost per game: 64 to 78
turnovers lost per game: 32 to 44
turnover margin per game: 16 to 66
GBR!
-
3
-
 1
1
-
-
Bored so I'm adding the conference rankings, based on the average averages for all the usual categories I'm tracking...

-
1
-
-
The NFL draft gives a pretty good indication, too. When's the last time we had an early pick? Randy Gregory?
We have a long way to go, Big Red.
p.s. - Sorry for my memory having failed me somewhat, Ameer:
-
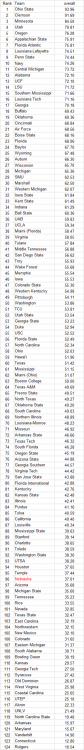
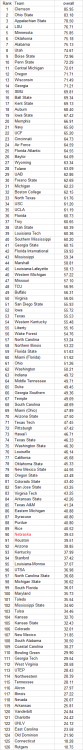
The numbers are averages of average percentiles for figures from the following statistical categories (as appropriate): pass d/o; rush d/o; scoring d/o; total d/o; and turnover margin. You can click on the data cells pasted below a couple of times to make them more legible but I think it opens up another tab in your browser in my experience, at least. You get what you pay for, I guess, but I'll take any free advice as to how I might be using the board wrong also.
B1G Rankings
National Overall Statistical Rankings
National Defensive Statistical Rankings
National Offensive Statistical Rankings
GBR !
-
3
-
-
People are awfully picky about what they get for sliding and clicking a mouse.
Two examples of criticism that's not constructive and one "like" from about 200 views are obviously not why I posted what's above.
GBR !
-
The numbers are averages of average percentiles for these stat categories (as appropriate): pass d/o; rush d/o; scoring d/o; total d/o; and turnover margin.
B1G
Nat'l Overall
Nat'l Defensively
Nat'l Offensively
GBR !
-
3
-
-
Just like every week, I'm only considering stats from conference games. The numbers are percentile rankings (such that 100 is the best rating you can get and 0 the worst). No adjustment has been made to reflect strength of schedule differences either.
NU vs. PU
Passing Defense
completions allowed per game: 78 (NU) to 59 (Boilers)
completion percentage allowed: 49 to 10
yards per attempt allowed: 65 to 10
touchdowns per game allowed: 63 to 63
qb rating allowed: 55 to 17
yards per game allowed: 82 to 47
Passing Offense
completions per game: 31 to 86
completion percentage: 71 to 52
yards per attempt: 60 to 28
touchdowns per game: 16 to 59
qb rating: 51 to 36
yards per game: 33 to 68
Rushing Defense
yards per game allowed: 9 to 54
touchdowns per game allowed: 4 to 44
yards per carry allowed: 9 to 53
Rushing Offense
yards per game: 75 to 7
touchdowns per game: 57 to 10
yards per carry: 54 to 4
Scoring Defense
touchdowns per game allowed: 22 to 53
points per game allowed: 24 to 52
Scoring Offense
touchdowns per game: 25 to 25
points per game: 20 to 22
Total Defense
yards per play allowed: 34 to 30
yards per game allowed: 41 to 51
plays per game allowed: 57 to 81
Total Offense:
yards per play: 47 to 16
yards per game: 56 to 23
plays per game: 71 to 67
Turnover Margin
fumbles gained per game: 9 to 31
interceptions gained per game: 32 to 47
turnovers gained per game: 11 to 35
fumbles lost per game: 6 to 32
interceptions lost per game: 70 to 53
turnovers lost per game: 28 to 41
turnover margin per game: 11 to 34
GBR!
-
1
-
-
1 minute ago, Guy Chamberlin said:
I was hoping for something with smaller type.
You click on those and windows should open with still one other level of magnification available. This is the best it has been in the years I've been sharing these figures. I.e., even the quality of the communication is relative!
")
-
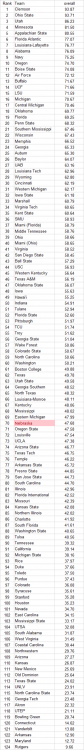
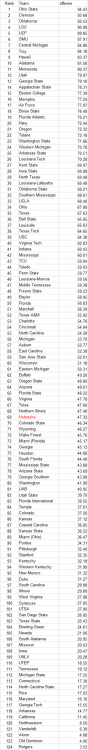
All the numbers for each team come from games against their conference foes so we can see who's really dominant versus their peers alone without uneven OOC scheduling tainting anything. Categories of stats used are: pass d and o, rush d and o, scoring d and o, total d and o, and turnover margin.
Nat'l Rankings per Best Overall Stats
Nat'l Rankings per Best Defensive Stats
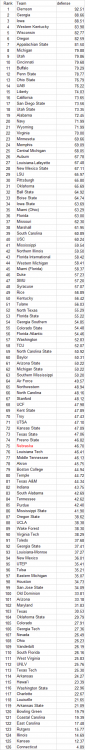
Nat'l Rankings per Best Offensive Stats
B1G Rankings across those nine categories listed above
-
3
-
-
On 10/20/2019 at 7:26 AM, gbrnu1 said:
Thanks, I'm a few generations removed from my great-great-grandmother who emigrated from Ireland. So I suppose things are a bit Anglicized. I'll try to remember the correct phrase moving forward.
I have made deposit to go to the game in 2021. Should be fun. GO BIG RED!
I had all of one survey-depth Irish Gaelic class or I'd be just as confused, brother. I might see you over there because it sounds like my dad wants to go maybe... GBR!
-
1
-
-
On 10/21/2019 at 6:39 AM, The Dude said:
I'll have you know I'm upwards of 12% Irish! Also, lighten up Francis.
I almost added a Stripes line to my response. Why are you posting a GIF with "I don't care" in it if you do? That's rhetorical. I just don't get answering someone else's mail like a jerk.
-
5 minutes ago, Ulty said:
Hey, first of all, I rarely have to "feign" my stupidity, brah. But there was no disdain at all - it was a joke based on your wording in the prior post.
Secondly, we all appreciate your insight in this thread, it is more informative and valuable than most HB posts. Kudos to you sir. Now calm down and buy me another Guinness.

I appreciate that, Ulty, and take it back. I will admit that I was partly affected by past experiences here that haven't been pleasant.


A tale of two Frost seasons per NU's B1G game stats
in Husker Football
Posted
The one (and pretty much only) thing I've always given Riley credit for was putting an end to the fumbling saga.
2012 - 22 fumbles lost
2013 - 16
2014 - 13
2015 - 6
2016 - 5
2017 - 2