Search the Community
Showing results for tags 'Statistics'.
Found 3 results
-
 I know there’s been a lot of chatter in the past few weeks about officiating and whether Nebraska has gotten a fair shake from the B1G officials. Well, instead of just making an assumption from casual observation (read: like I and many others have) one way or another...a Redditor by the name of u/themrincredible put 20+ hours of work into the underlying statistical analysis necessary to determine the answer to the question...and the answer is...well...read the post for yourself: https://www.reddit.com/r/Huskers/comments/9s9csd/the_fix_is_in_well_you_be_the_judge/?st=JNU703KK&sh=62ca5d84 BTW, I’ll warn folks: it’s long, it’s through, and it involves math, charts, data tables, and the like. Not for the faint of heart, posters with ADD, or posters who harbor aversions to data and factual information. — As for the conclusions reached, it’s pretty much mathematical collaboration to what many have seen with your eyeballs.
 -
We all know there's not much of a sample size to be had at this point. Schedule strength is different. One team has had the same QB for the most part, insofar as I'm aware (only having watched our B1G home field favorites* against Notre Dame this season). I'm going to share the percentiles with more of a focus this time around since it seemed like some found the last post to be a bit much. I'll just respond with the additional data so no one post, with the Nebraska-focused stuff, is quite so gigantic. I suppose I'll run the risk of someone claiming I'm just trying to pad my post count now but here it go... passing defense completions per game: 1 to 12 (after 1 and now 2 games, respectively, for the good guys) with the skunkbears posting 73 (after having played three, I believe) percentage: 15 to 13, 78 yards per attempt: 47 to 62, 88 touchdowns per game: 6 to 49, 57 passer rating: 26 to 42, 81 yards per game: 4 to 44, 85 passing offense: completions per game: 47 to 47, 34 percentage: 71 to 83, 91 yards per attempt: 58 to 42, 72 touchdowns per game: 20 to 34, 67 passer rating: 45 to 44, 85 yards per game: 47 to 31, 33 rushing defense yards per carry: 97 to 87, 79 touchdowns per game: 64 to 48, 82 yards per game: 94 to 85, 72 rushing offense yards per carry: 85 to 65, 68 touchdowns per game: 82 to 31, 50 yards per game: 97 to 87, 51 scoring defense touchdowns per game: 26 to 40, 80 points per game: 20 to 36, 82 scoring offense touchdowns per game: 44 to 22, 69 points per game: 34 to 19, 65 total defense yards per play: 71 to 77, 91 yards per game: 40 to 73, 88 plays per game: 3 to 47, 51 total offense yards per play: 73 to 46, 71 yards per game: 91 to 66, 36 plays per game: 95 to 86, 5 (so meatchicken apparently has gone three and out a lot?) turnover margin fumbles gained per game: 12 to 35, 9 (so there's one good bit of news here, at least) interceptions gained per game: 8 to 25, 56 turnovers gained per game: 4 to 22, 22 fumbles lost per game: 1 to 3, 77 interceptions lost per game: 34 to 9, 59 turnovers lost per game: 3 to 1, 74 turnover margin per game: 1 to 2, 44 * - If all you know is that it's BS the Corn have to travel to a whore named Ann Arbor for a third time before getting a second game in Lincoln, you might be interested to know that these guys in the winged helmets (originally worn at Princeton) went decades at a time hosting the likes of Indiana and Michigan State. Given there is such a thing as home field advantage, it puts certain claims on the record books into perspective. Let's remember, too, that people first think of prison when they hear the name of the stadium Tommy Armstrong won in as a true freshman...
- 11 replies
-
- 2
-

-
- lies?
- damn lies?
- (and 1 more)
-
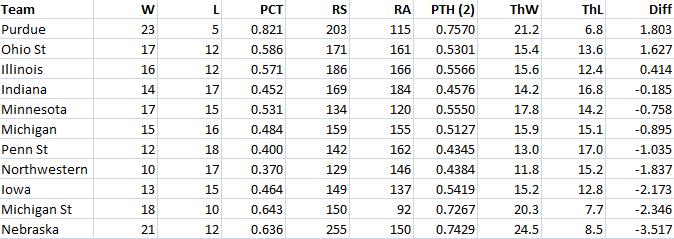
And here are the statistics to prove it. A team's Pythagorean Record is what their record should be based on the number of runs they score and allow. It is a metric developed by Bill James, who was basically the founder of sabermetrics. It's fairly obvious that run differential is correlated to winning percentage, so it shouldn't come as any surprise that a solid relationship like this exists. Anyway, this is how the B1G looks in terms of Pythagorean records: The table includes the team's Pythagorean winning percentage (using an exponent of 2), as well as the team's expected record based on that percentage. From there, you can look at the last column and see how many wins a team is deviating from their expectation. According to this, Nebraska should have 3.5 more wins than they do, which leads the conference. Also, Purdue has won 1.8 more wins than the numbers would expect. What does this mean? Have we been unlucky so far this year? Or, is there a reason we're underacheiving? Are we "due" for a streak?