You are using an out of date browser. It may not display this or other websites correctly.
You should upgrade or use an alternative browser.
You should upgrade or use an alternative browser.
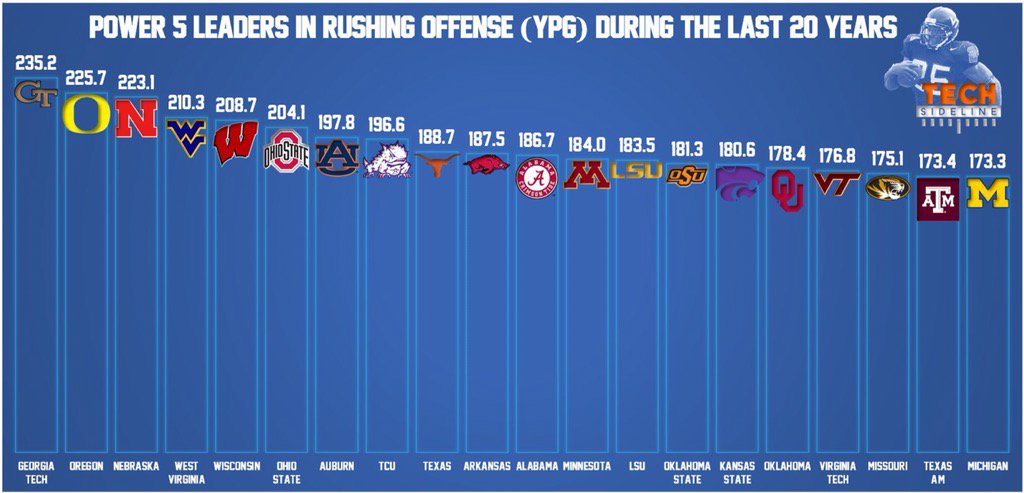
Top Rushing Offenses of the Last 20 Years
- Thread starter Mavric
- Start date
Landlord
Banned
I'm surprised we're that high on the list considering we've actually had a few years lately when we passed the ball quite a bit.:
2005, 2007, 2008 and 2015 are the only years I can think of where we were even over 50% passing, and still nowhere close to an air raid or anything of the sort.
Guy Chamberlin
Heisman Trophy Winner
Interestingly enough, even some of our mediocre rushing years would have been at the top of the curve, and the worst years still in the Top 20.I'm surprised we're that high on the list considering we've actually had a few years lately when we passed the ball quite a bit.:
2005, 2007, 2008 and 2015 are the only years I can think of where we were even over 50% passing, and still nowhere close to an air raid or anything of the sort.
Riley's pass-happy year still averaged 180 yards rushing a game (higher than OU's 20 year average)
Both Beck and Watson maintained 240 - 250 yards rushing a game in their balanced offenses, which would top this list.
Solich's "bad" years were 235 - 265 yards rushing a game. His good years would seem to cover Callahan's anemic years, leaving the 1996 and 1997 teams to pile on more rushing gravy.
I'm not convinced the 223.1 figure for Nebraska is accurate, and Georgia Tech's 235 average seems pretty modest for a rushing leader.
California Husker
Starter
Using the stats listed on Huskers.com that number is low. I don't know how accurate the numbers are on the Huskers website, but the average would actually be 232.04 which would place Nebraska in 2nd place behind GT.Interestingly enough, even some of our mediocre rushing years would have been at the top of the curve, and the worst years still in the Top 20.I'm surprised we're that high on the list considering we've actually had a few years lately when we passed the ball quite a bit.:
2005, 2007, 2008 and 2015 are the only years I can think of where we were even over 50% passing, and still nowhere close to an air raid or anything of the sort.
Riley's pass-happy year still averaged 180 yards rushing a game (higher than OU's 20 year average)
Both Beck and Watson maintained 240 - 250 yards rushing a game in their balanced offenses, which would top this list.
Solich's "bad" years were 235 - 265 yards rushing a game. His good years would seem to cover Callahan's anemic years, leaving the 1996 and 1997 teams to pile on more rushing gravy.
I'm not convinced the 223.1 figure for Nebraska is accurate, and Georgia Tech's 235 average seems pretty modest for a rushing leader.
As some have said, if not for the abysmal Callahan years, Nebraska would lead all schools.
1996 - 291.9I'm not convinced the 223.1 figure for Nebraska is accurate, and Georgia Tech's 235 average seems pretty modest for a rushing leader.
1997 - 392.6
1998 - 253.8
1999 - 265.9
2000 - 349.3
2001 - 314.7
2002 - 268.7
2003 - 235.6
2004 - 176.3
2005 - 96.0
2006 - 170.5
2007 - 144.4
2008 - 169.8
2009 - 147.1
2010 - 247.6
2011 - 217.2
2012 - 253.4
2013 - 215.7
2014 - 240.2
2015 - 180.0
AVG - 231.5
I took my stats off Huskers.com which includes bowl games. Perhaps their numbers didn't include them.
Kind of went in streaks. 1996-2003 averaged 296.6. 2004-2009 averaged 150.7. 2010-2014 averaged 234.8. I'm thinking last year's 180 will be pretty common going forward - maybe the high point.
Johnson has only been coaching at Georgia Tech since 2008. Before that they weren't that much of a rushing team - or particularly good for that matter.
California Husker
Starter
Yeah, I used those same numbers....and GEEZ, WTH happened in 2005?1996 - 291.9I'm not convinced the 223.1 figure for Nebraska is accurate, and Georgia Tech's 235 average seems pretty modest for a rushing leader.
1997 - 392.6
1998 - 253.8
1999 - 265.9
2000 - 349.3
2001 - 314.7
2002 - 268.7
2003 - 235.6
2004 - 176.3
2005 - 96.0
2006 - 170.5
2007 - 144.4
2008 - 169.8
2009 - 147.1
2010 - 247.6
2011 - 217.2
2012 - 253.4
2013 - 215.7
2014 - 240.2
2015 - 180.0
AVG - 231.5
I took my stats off Huskers.com which includes bowl games. Perhaps their numbers didn't include them.
Kind of went in streaks. 1996-2003 averaged 296.6. 2004-2009 averaged 150.7. 2010-2014 averaged 234.8. I'm thinking last year's 180 will be pretty common going forward - maybe the high point.
Johnson has only been coaching at Georgia Tech since 2008. Before that they weren't that much of a rushing team - or particularly good for that matter.
Landlord
Banned
Yeah, I used those same numbers....and GEEZ, WTH happened in 2005?
No offensive line of any kind.
Yeah, I used those same numbers....and GEEZ, WTH happened in 2005?
Last edited by a moderator:
Without doing any research, I'm gonna guess sacks played a big role in this number. Wasn't this Zac Taylor's first year as NU's starter. He was the least mobile NU QB I can remember.Yeah, I used those same numbers....and GEEZ, WTH happened in 2005?
No offensive line of any kind.