

beorach
-
Posts
803 -
Joined
-
Last visited
Content Type
Profiles
Forums
Events
Articles
Media Demo
Posts posted by beorach
-
-
On 10/15/2019 at 8:13 AM, gbrnu1 said:
Going to Ireland is on my bucket list. Combining it with a Husker game just might be the ticket. Erin Go Bragh & Go Big Red!
"Erin Go Bragh" is the Anglicized gibberish version of " Éire go brách."
-
11 minutes ago, Fru said:
I finished reading “Paddy’s Lament: Prelude to Hatred” a while back. All about Ireland in the 1840’s (incredible read for anyone that has Irish ancestry or is interested in the country). I wanna say the book said Ireland produced enough food to feed everyone two or three times over.Thanks for the suggestion, Fru. My local library doesn't seem to have it but their website is a little confusing.
The last bit of non-fiction I read was "Blanketmen" from Richard O'Rawe. It was about the IRA hunger strike in the eighties. I figure that's probably something most Americans don't know about as well. Rangers fans seem to enjoy singing about one of its fatalities, though. The fascination with the Troubles in modern Scotland baffles me.
-
 1
1
-
-
3 minutes ago, Ulty said:
What was your family's ethnicity before the potato blight?
An Irish-American's ethnicity doesn't change with his/her address. I think your a$$ is smart enough to figure it out.
")
-
17 hours ago, Swiv3D said:
So then why do they have it as a color in their flag?
My family has been Irish-American since the potato blight of the late 1840's but I'll try to give a rough explanation.
The green is for the Catholics, the orange the Protestants, and the white unity between the two.
The Dutch and the English fought the Irish and French in Ireland over the crown that once belonged to the Catholic King James (often referred to as Séamus an Chaca (James the Sh*t)). The decisive battle was fought at Aughrim and makes for a particularly interesting story from the days of King James. Oliver Cromwell is likely the most vilified of the English authorities. Vikings and Norman English forces had conquered previously but didn't try to eradicate the culture like the English did following that time. You couldn't speak the Irish tongue nor practice the Catholic religion and keep your land under the Penal Laws. This is tip of the iceberg stuff, of course, and I'd recommend people study up online, at least, if they're interested. I know I didn't get much of an education as to Ireland in American schools. It's somewhat maddening that people don't know Ireland had enough (non-tuber) food to feed itself during the so-called "famine," for example.
p.s. - This was a cool site that gives you a lot in very little space: Irish History
-
3
-
-
We've come a long way, I suppose:
https://hailvarsity.com/s/2789/nebraska-mashes-notre-dame-on-thanksgiving
http://www.irishlegends.com/pages/reflections/reflections30.html
GBR! CCFOND!
-
2
-
-
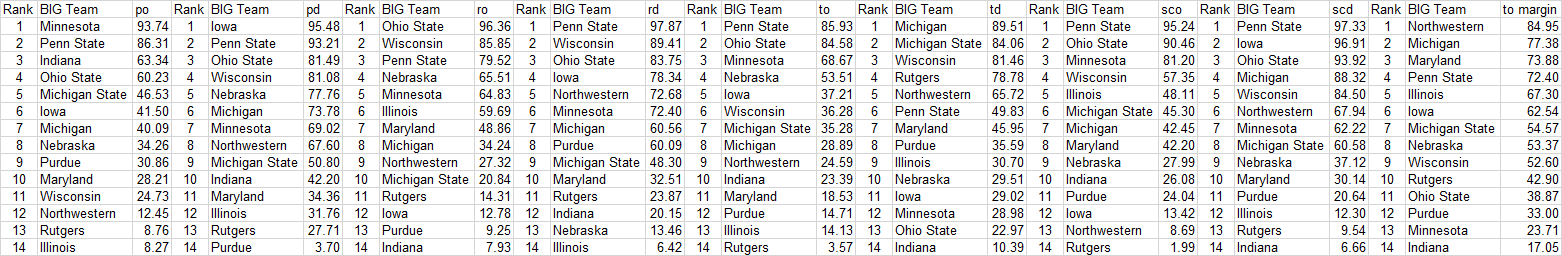
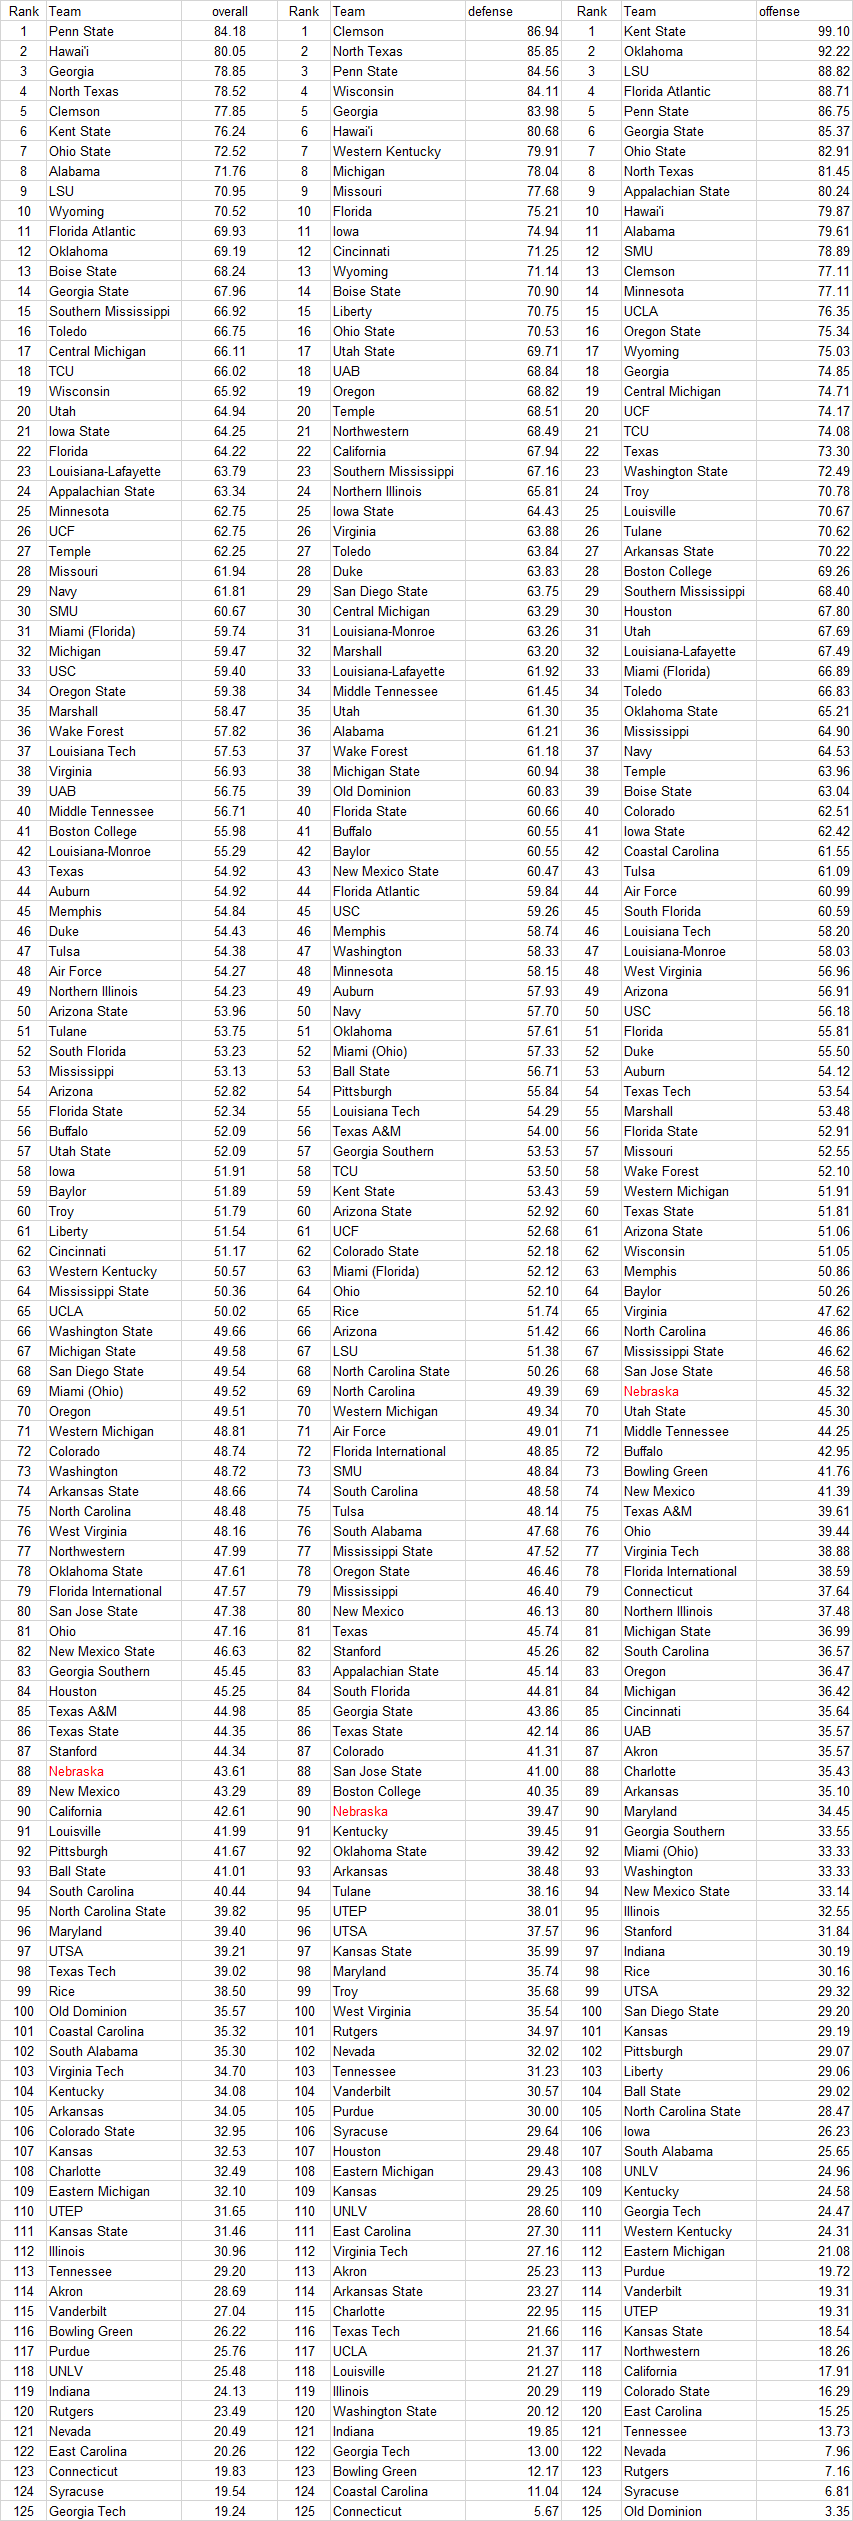
B1G
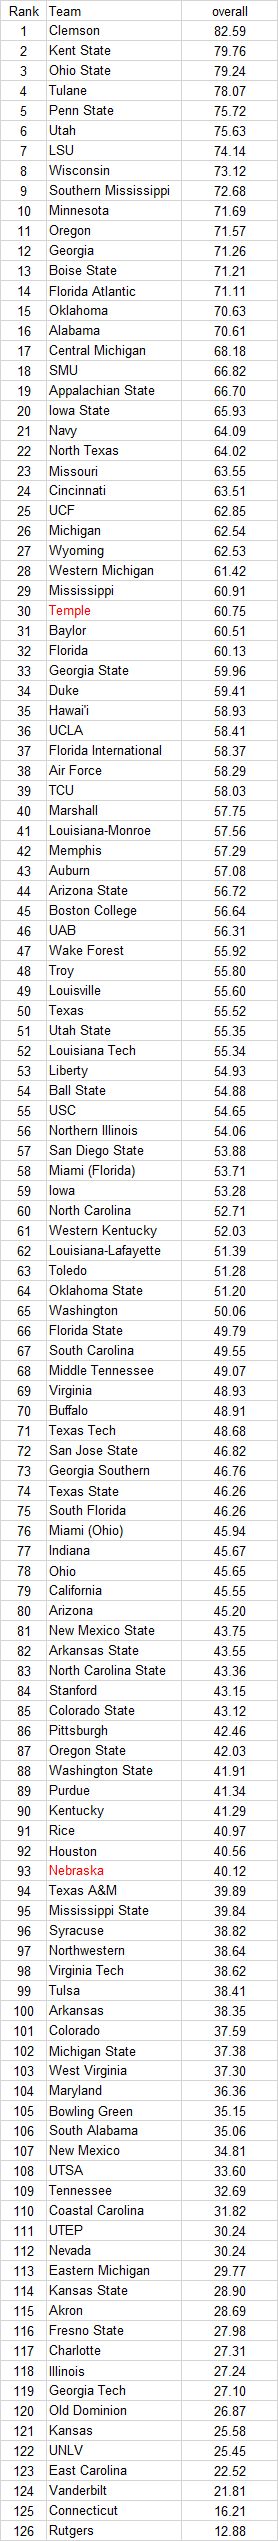
Overall
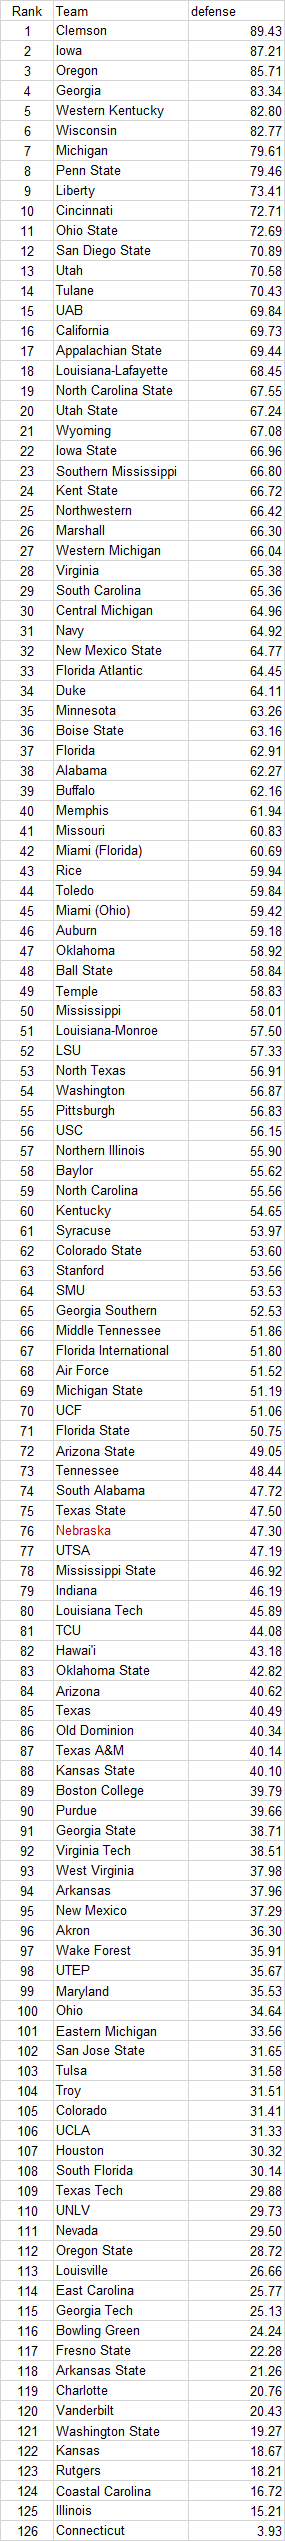
Defense
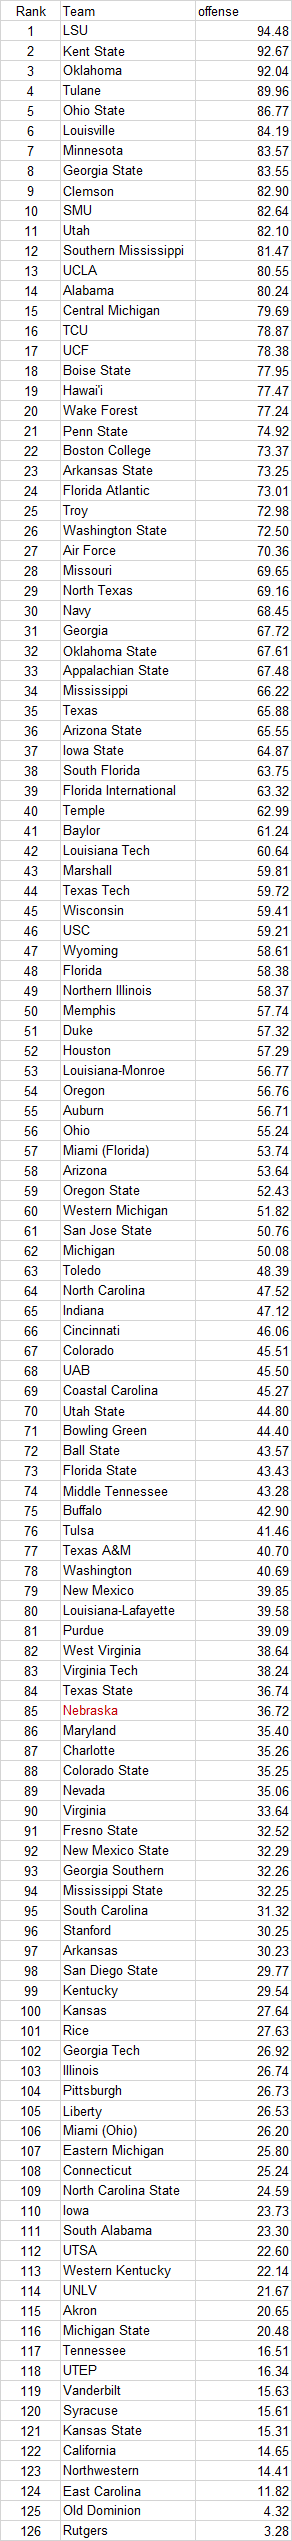
Offense
-
2
-
-
Just like last week, I'm only considering stats from conference games. The numbers are percentile rankings (such that 100 is the best rating you can get and 0 the worst). Indiana has played Ohio State, Michigan State, and Rutgers to garner their stats.
NU vs. IN
Passing Defense
completions allowed per game: 93 (NU) vs. 86 (IN)
completion percentage allowed: 70 to 79
yards per attempt allowed: 84 to 65
touchdowns per game allowed: 71 to 32
qb rating allowed: 72 to 48
yards per game allowed: 95 to 81
Passing Offense
completions per game: 23 to 94
completion percentage: 38 to 93
yards per attempt: 35 to 49
touchdowns per game: 16 to 75
qb rating: 27 to 68
yards per game: 20 to 78
Rushing Defense
yards per game allowed: 3 to 44
touchdowns per game allowed: 5 to 56
yards per carry allowed: 4 to 30
Rushing Offense
yards per game: 74 to 34
touchdowns per game: 45 to 24
yards per carry: 56 to 54
Scoring Defense
touchdowns per game allowed: 25 to 33
points per game allowed: 28 to 40
Scoring Offense
touchdowns per game: 18 to 52
points per game: 13 to 50
Total Defense
yards per play allowed: 38 to 51
yards per game allowed: 46 to 71
plays per game allowed: 61 to 86
Total Offense:
yards per play: 32 to 61
yards per game: 42 to 63
plays per game: 67 to 56
Turnover Margin
fumbles gained per game: 10 to 60
interceptions gained per game: 27 to 14
turnovers gained per game: 10 to 26
fumbles lost per game: 20 to 62
interceptions lost per game: 58 to 58
turnovers lost per game: 35 to 63
turnover margin per game: 12 to 40
-
Stats are tough to compare with the strength of schedule pretty different, yes, and then you figure we're nicked up. I don't know how healthy they are but would expect us to be able to hang within a TD of any Minnesota team. It bears mentioning that, even with the SOS difference, they've given up about the same number of yards we have and have a turnover margin that's considerably worse (from two conference games versus Illinois and Purdue).
-
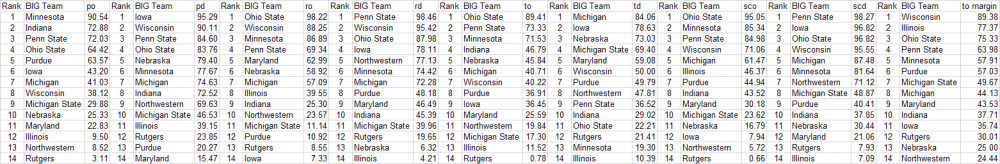
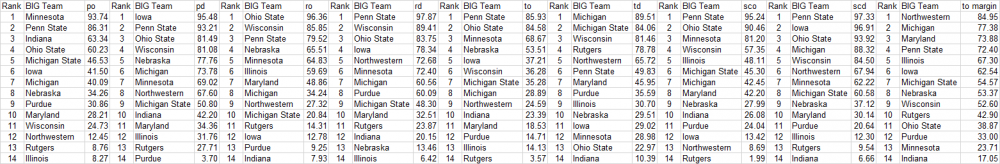
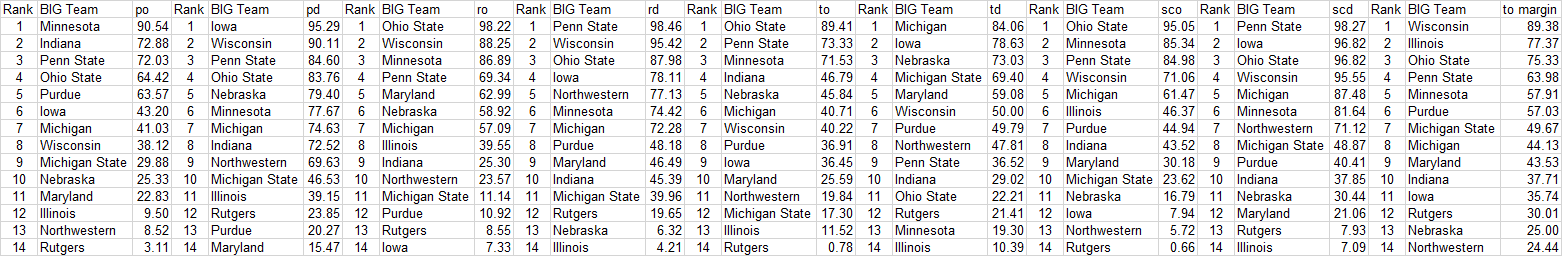
I explained the methodology for the rankings in my last post that featured all the stats I track for Nebraska and Minnesota. No adjustments have been made for strength of schedule and the average number of conference games an FBS team has played is just two at this point (so take them with a grain of salt or whatever that saying is). By "conference games only," I mean I'm not including any stats from games against bigger or smaller teams. Everyone is judged by playing against their peers (conference foes if I want to sound like an old man) only.
Here are the B1G rankings:
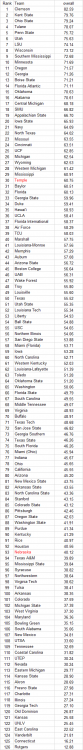
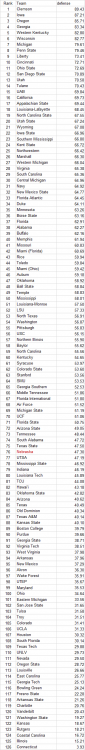
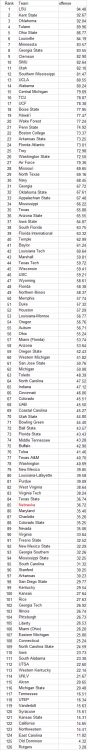
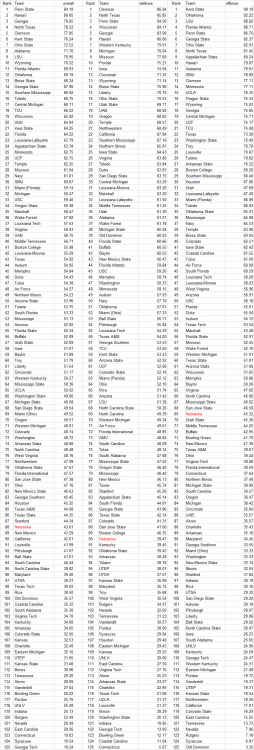
Here are the national rankings:
-
2
-
-
36 minutes ago, cheekygeek said:
I'm told that flipping a coin helps gamblers - some years.
Flipping a coin isn't all it's cracked up to be (i.e., a 50/50 proposition), though, if you know your physics.
-
1 minute ago, Nebfanatic said:
So because teams can't run it on us they have to pass more often. You'd still like to see better performance in categories such as yards per attempt and QB rating if volume is being affected because your run defense is really good.
Or the numbers in the RD category are inflated because teams just find it easier and more advantageous to pass? I'm not saying I have it figured out by any means but there's definitely some interdependence if that's a word... These answers are just easier to come by and understand than a lot of things I see online.
-
1
-
-
8 minutes ago, Nebfanatic said:
We have played 3 games so that makes a slight difference.
I try to always normalize figures by dividing by the number of games (which you can see in what I listed because those are all the stats I'm tracking). The strength of schedule difference is what I always struggle with in terms of how to adjust stats/spreads. Minnesota has played Illinois and Purdue. I think Purdue having played two P5 teams from outside the B1G to open its season likely meant the Gophers didn't get them at full strength either but didn't watch any of their game, to be fair...
p.s. - Numbers in the rushing defense category obviously have a lot to do with how poor some of the numbers are in the passing defense category.
-
1 minute ago, WyoHusker56 said:
I believe that's right. So, if you're in the 56th percentile you're better than 56% of the teams in that case I think.
You guys have it right. 100th percentile is the best you can get. I had some z-scores (which I convert to percentiles) calculated wrong in a bunch of cells when I first posted for whatever reason so the numbers are updated now (like 12:20 on Tuesday the 8th). Sorry for the confusion.
GBR!
-
 2
2
-
-
Gaa, I found an error in at least a couple of the spreadsheets so I'll be updating in the near future.
The big takeaway for these numbers is the average number of conference games played by FBS teams so far this season is only 2.
-
22 minutes ago, Nebfanatic said:
Curious @beorach could you do the percentiles for TFLs for and against as well as sacks?
Our sack yards figure puts us at the 63rd percentile.
Our sacks per game figure puts us at the 36th percentile.
Our TFL yards figure puts us at the 79th percentile.
Our TFL per game figure puts us at the 56th percentile.
-
1
-
-
I'm only taking data from games between conference opponents so independents are not represented. That means a B1G's team rankings are based on games against other B1G teams only. For nine categories, I'm averaging the percentile ratings for all the stats I could make sense of (to figure into a spread calculation) from within those categories for all the teams. I average all those averages for the overall rating, all the defensive ones for the defense, etc. For Nebraska and our beloved Corn's next opponent, I'm sharing all the figures. Enjoy or don't. I started doing this to help me gamble and some years it has...
NU vs. MN
Passing Defense
completions allowed per game: 82 (NU) vs. 21 (MN)
completion percentage allowed: 67 to 73
yards per attempt allowed: 83 to 88
touchdowns per game allowed: 65 to 76
qb rating allowed: 74 to 86
yards per game allowed: 89 to 58
Passing Offense
completions per game: 24 to 24
completion percentage: 48 to 96
yards per attempt: 46 to 100
touchdowns per game: 26 to 92
qb rating: 39 to 100
yards per game: 26 to 67
Rushing Defense
yards per game allowed: 12 to 79
touchdowns per game allowed: 15 to 71
yards per carry allowed: 14 to 67
Rushing Offense
yards per game: 63 to 71
touchdowns per game: 53 to 47
yards per carry: 78 to 74
Scoring Defense
touchdowns per game allowed: 38 to 61
points per game allowed: 36 to 63
Scoring Offense
touchdowns per game: 30 to 80
points per game: 26 to 82
Total Defense
yards per play allowed: 54 to 83
yards per game allowed: 55 to 76
plays per game allowed: 53 to 34
Total Offense:
yards per play: 45 to 94
yards per game: 52 to 80
plays per game: 63 to 17
Turnover Margin
fumbles gained per game: 16 to 16
interceptions gained per game: 37 to 77
turnovers gained per game: 19 to 47
fumbles lost per game: 11 to 59
interceptions lost per game: 44 to 69
turnovers lost per game: 22 to 69
turnover margin per game: 14 to 61
-
1
-
-
Just be careful walking by the dorms, based on my (and Brent Musburger's?) experience.
-
I want Omaha basketball (Jays and Mavs) to succeed as well as Lincoln basketball. Wesleyan has probably had the most postseason success in recent years (if we aren't talking only D1). p.s. - I've never watched Bellevue's team but I guess they should be included as part of Omaha?
-
1
-
-
The first Rutgers and Iowa games had Copeland so, yeah, I don't think we should use that as too big an excuse. No team's going to excel shooting the way the Huskers did a lot of games, too, of course. I mainly came here (after finishing the game watch last night - damn 8:30 start and early work mornings) to see what people thought of the soccer-level play-acting from the TCU kid that saw Roby ejected. What's he doing on him after the ball is gone anyway?
-
I've only got radio coverage on 590 so I don't have a great feel but it sounds like they're playing hard, getting steals and rebounds (just not calls).
GBR!
-
24 minutes ago, Mavric said:
Yeah!!! We beat a barely .500 team who's 7th in their conference!!!
We didn't just beat them, though, was the point... It seemed like the guys exorcised the demons. I don't know what the other high point of the season would be. At the time, I thought the Indiana win was better than I think it was now.
-
We'll always have the Creighton game...
-
Remember they were blackballed first and even quit playing Nebraska once over a racist/sectarian halftime show. The Hail Varsity article is kinder than what I've read from the Drunks' archives:
-
I remember a couple of layups and a free throw before I fast-forwarded and just watched the score last night (so I didn't realize). It's too bad his pace has slowed of late.
Huskers to Play Illinois in Ireland in ... 2022?
in Husker Football
Posted
I guess I humored Ulty's (disdain masquerading as) feigned stupidity so it stands to reason that responding again will only result in more of the same but whatever... You guys seem to need something to do and it seems to be appreciated more than my having spent a few minutes answering someone's question (prefaced with a straightforward disclaimer as to my level of familiarity with a foreign nation whose immigrants to this country have been vilified by Husker fans in the past). I can respect that Husker fans need all the joy they can get of late.