
N is for nowledge
-
Posts
331 -
Joined
-
Last visited
N is for nowledge's Achievements
")
Three-Star Recruit (4/21)
331
Reputation
-
Coronavirus Disease (COVID-19)
N is for nowledge replied to suh_fan93's topic in Big Red Lounge: Official BS Forum
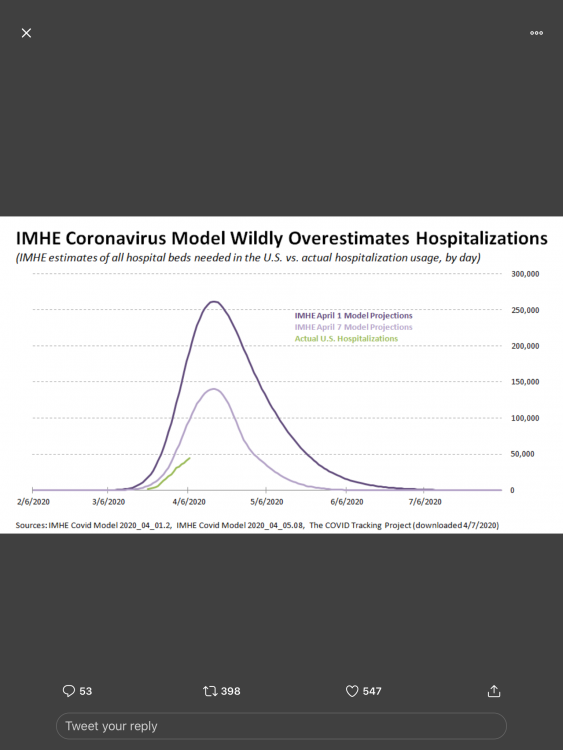
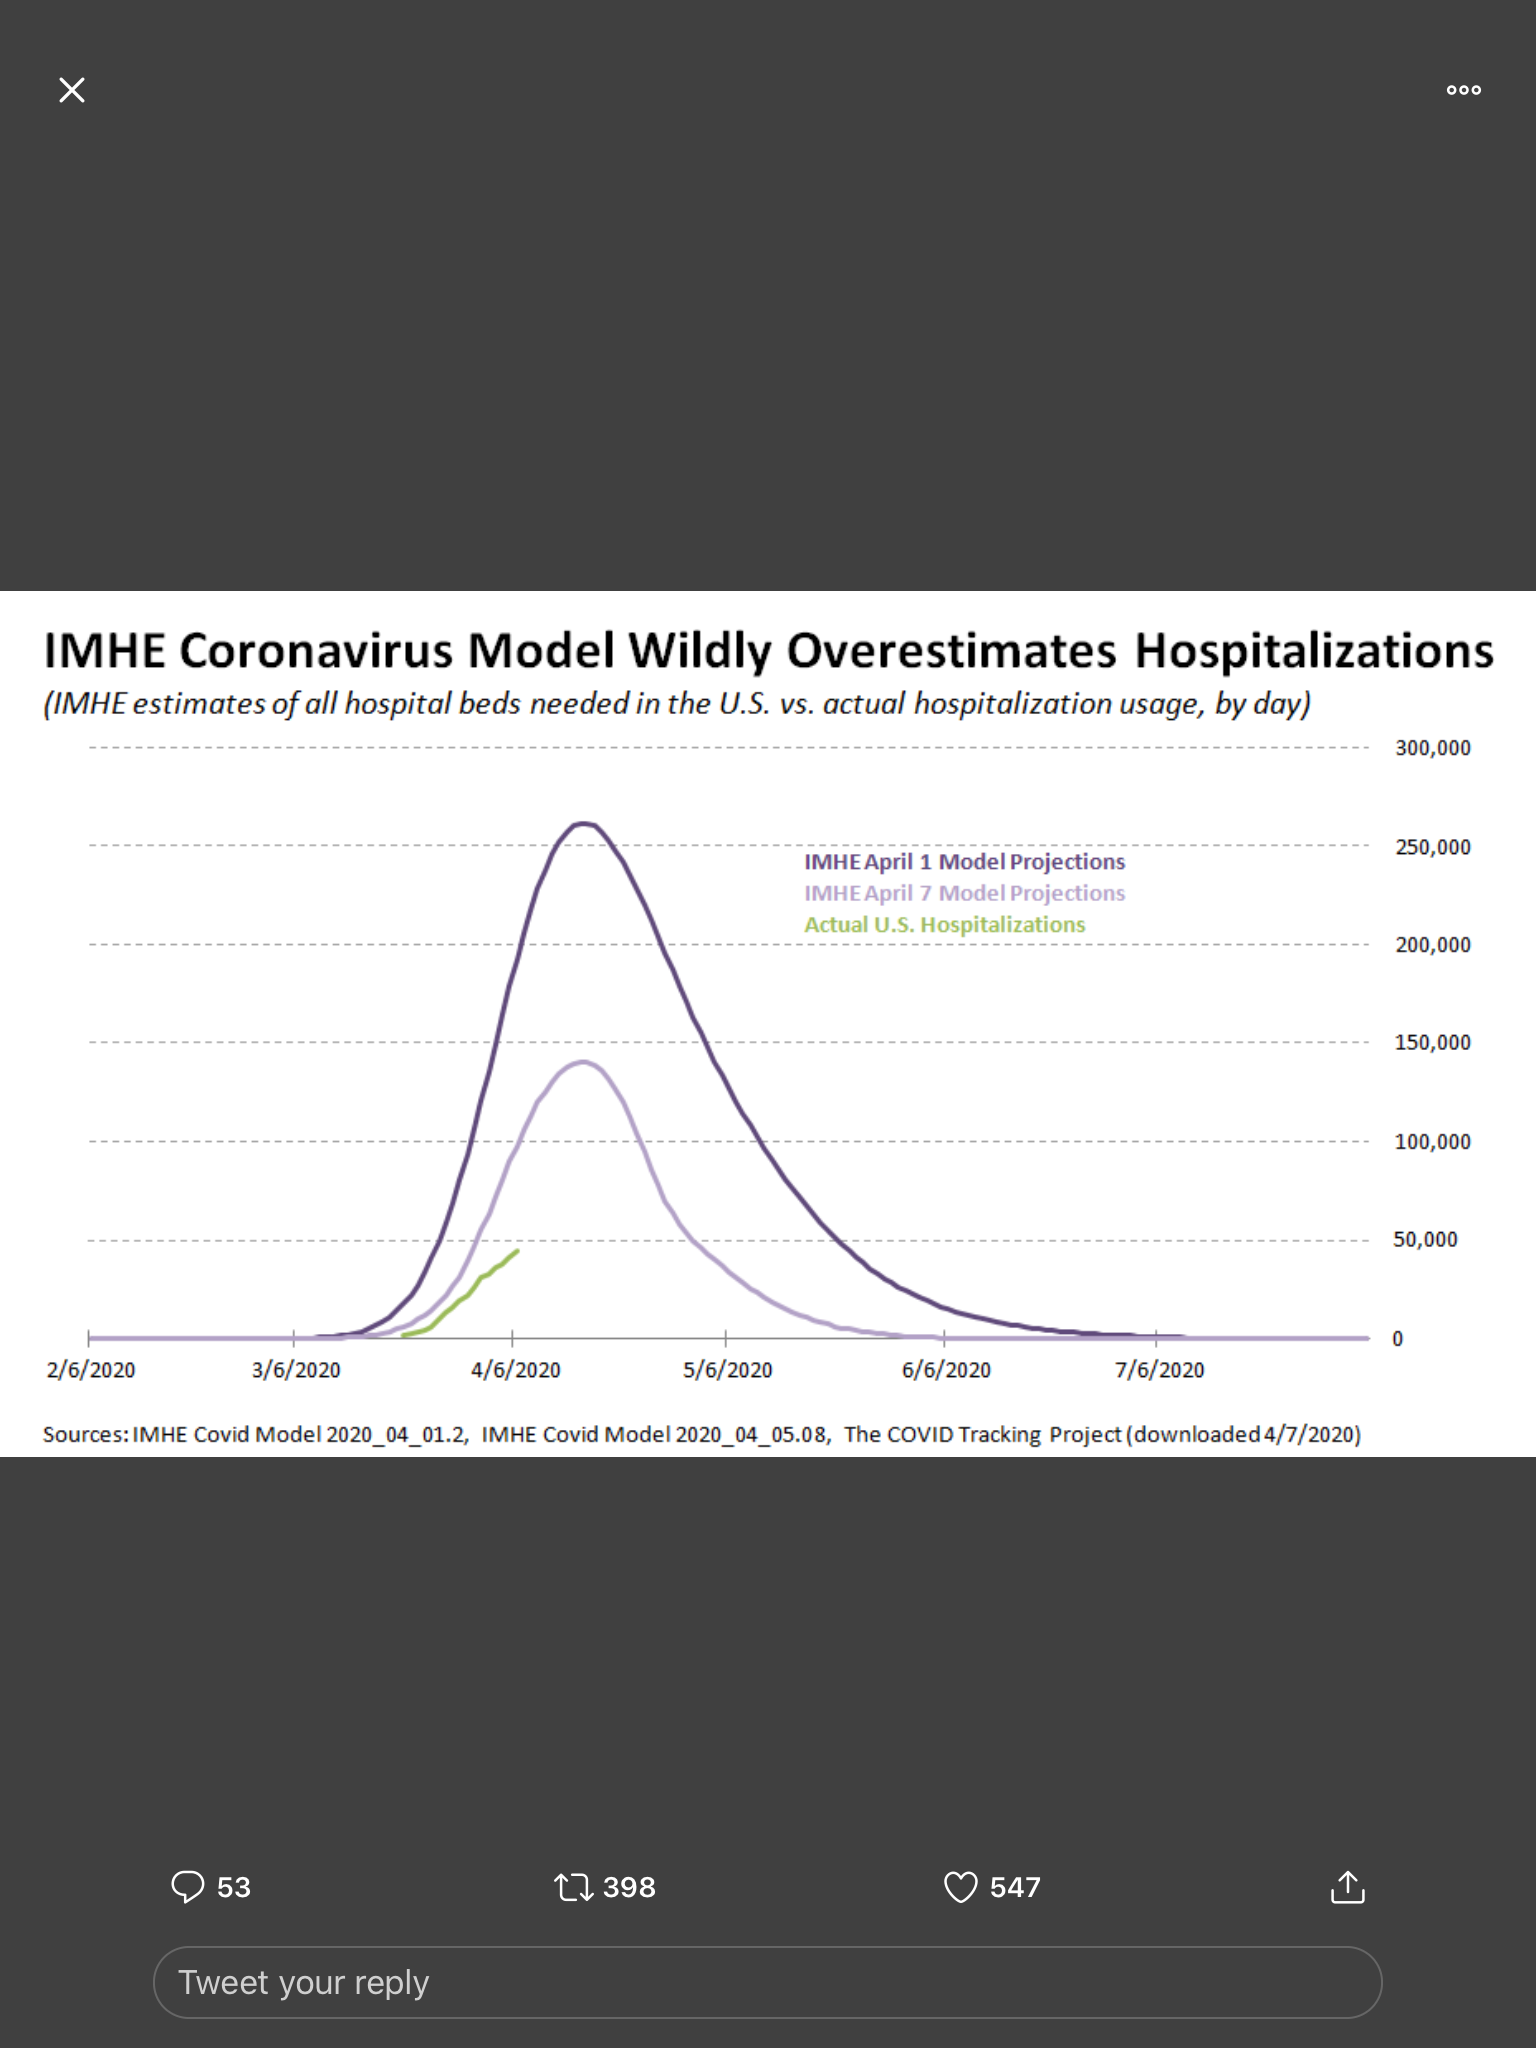
Systems are prepping for peak so yes 37k vs 16K is off substantially. This is why governors are saying don’t have enough “x”. Reserving beds, furloughing healthcare workers because they are looking at this model. They have to prep for the peak, a peak that will never come -
Coronavirus Disease (COVID-19)
N is for nowledge replied to suh_fan93's topic in Big Red Lounge: Official BS Forum
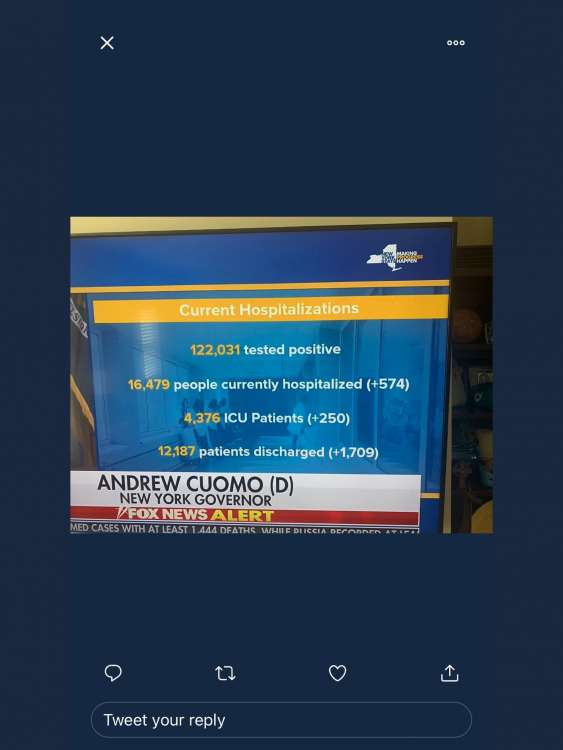
It does when you look at it in view Of the other picture from cuomo presser from the same day again, the numbers projected vs actual are wildly different and well documented. Graph or not. -
Coronavirus Disease (COVID-19)
N is for nowledge replied to suh_fan93's topic in Big Red Lounge: Official BS Forum
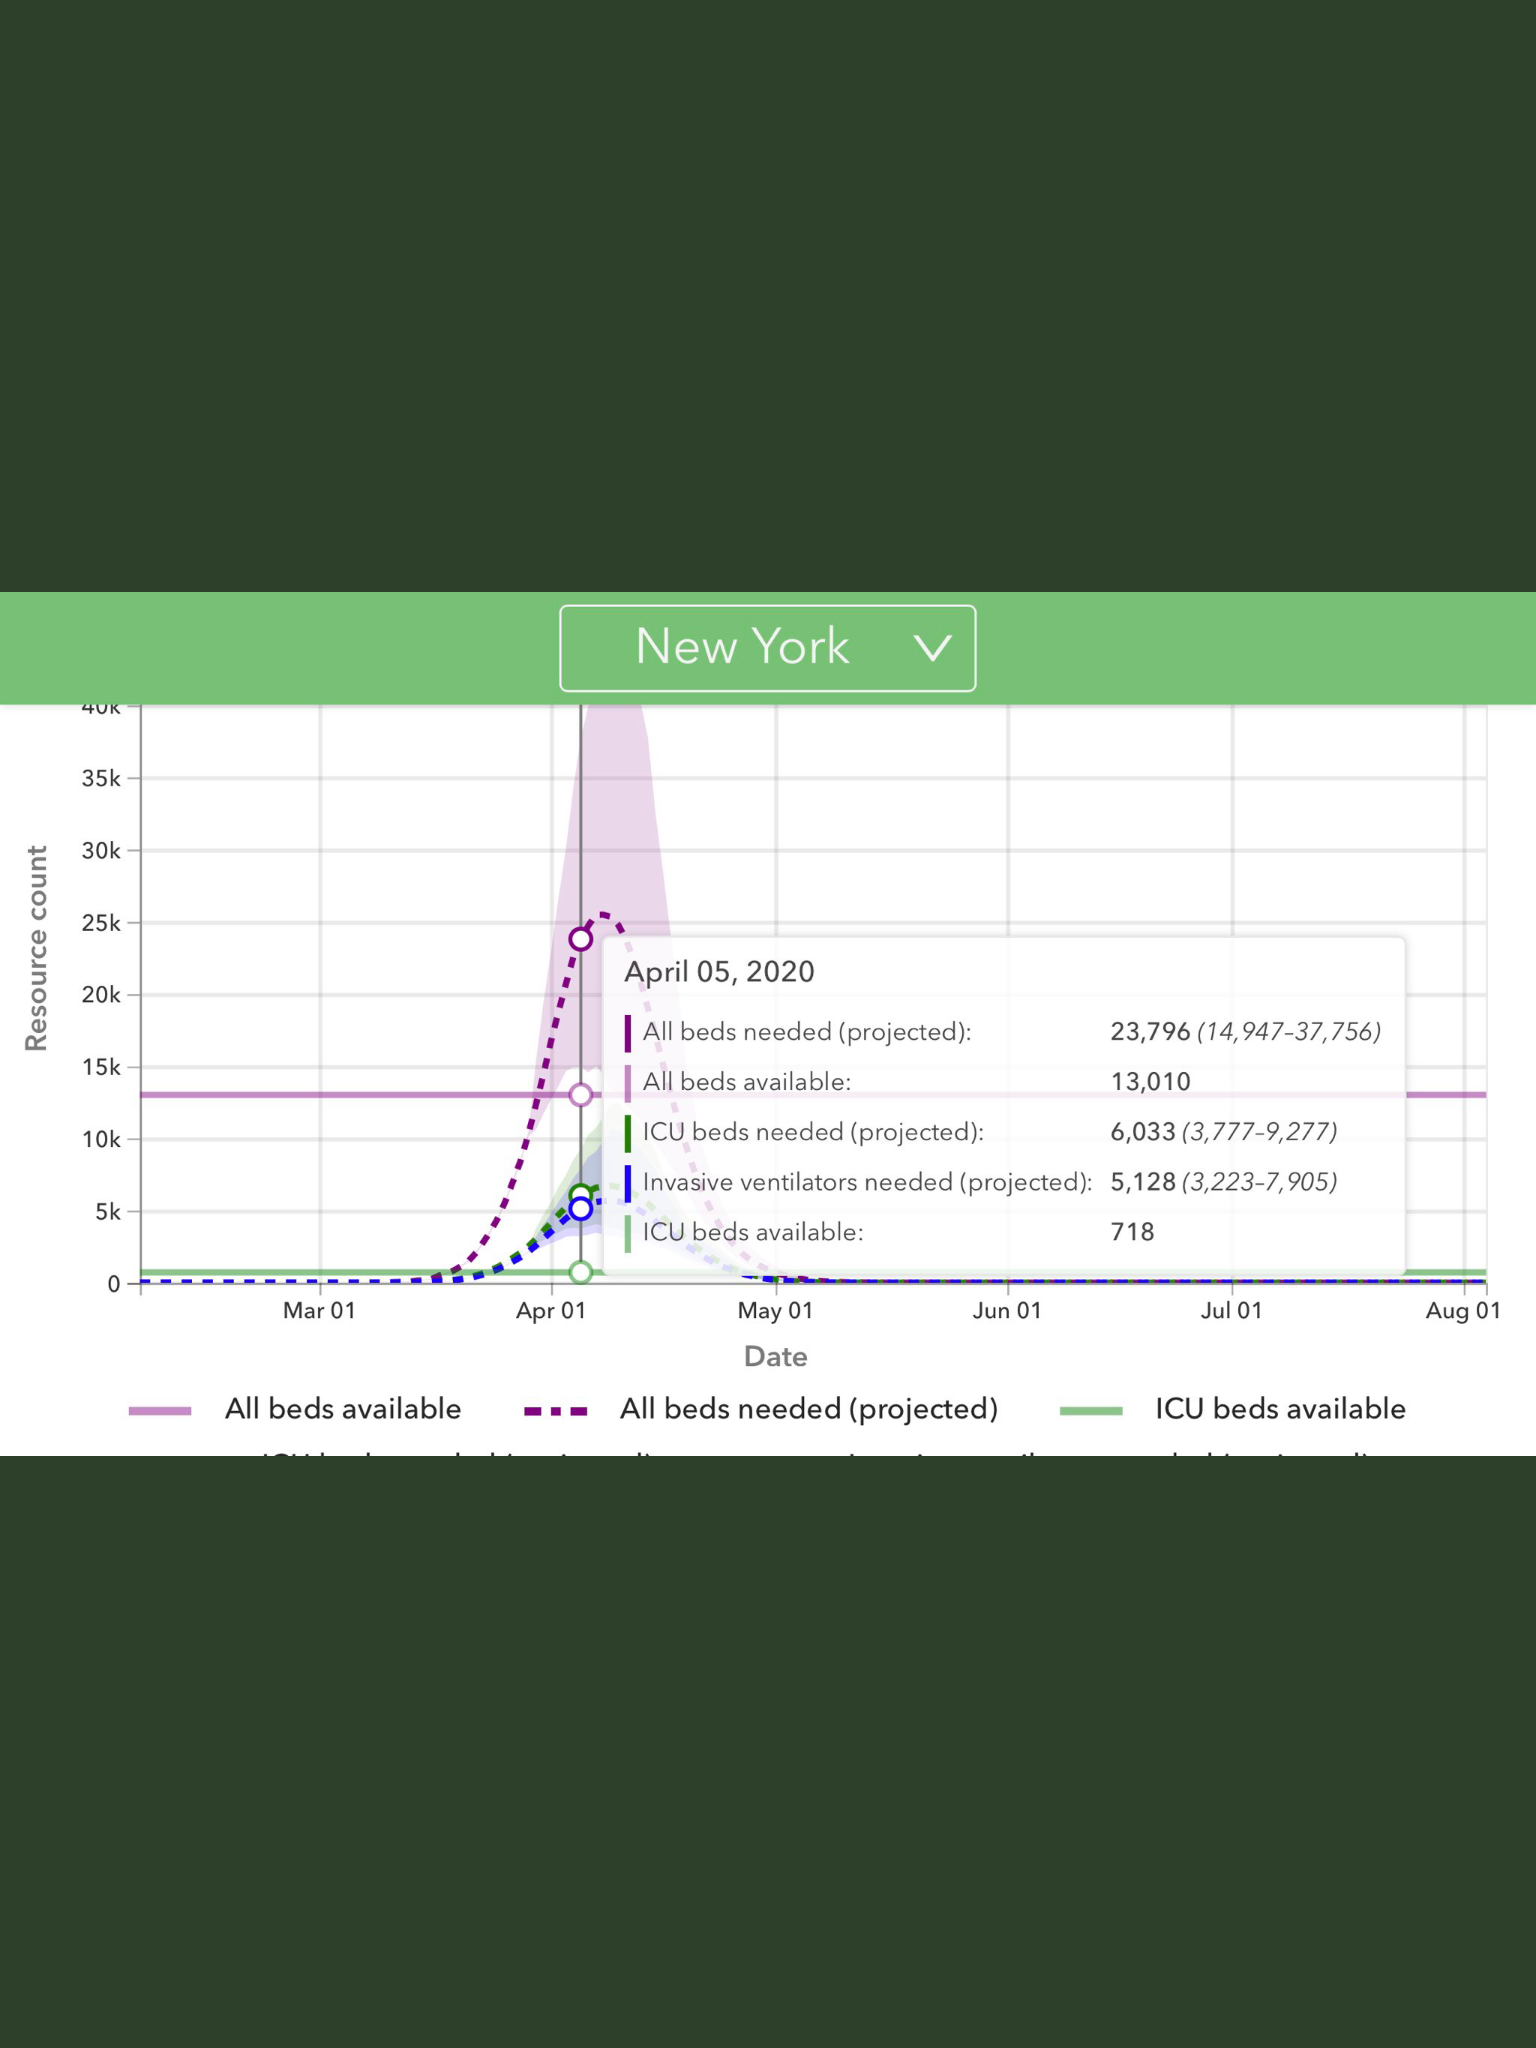
So I’ll agree. The graph seems put together by someone outside IHME. However it does cite them as a reference as it does the covid research project. Here are a couple others from the April 6th update or 3.0. Was off the day they released it. I get wanting to know where stuff comes from but the numbers are the numbers regardless of who put the graph together, yes or no.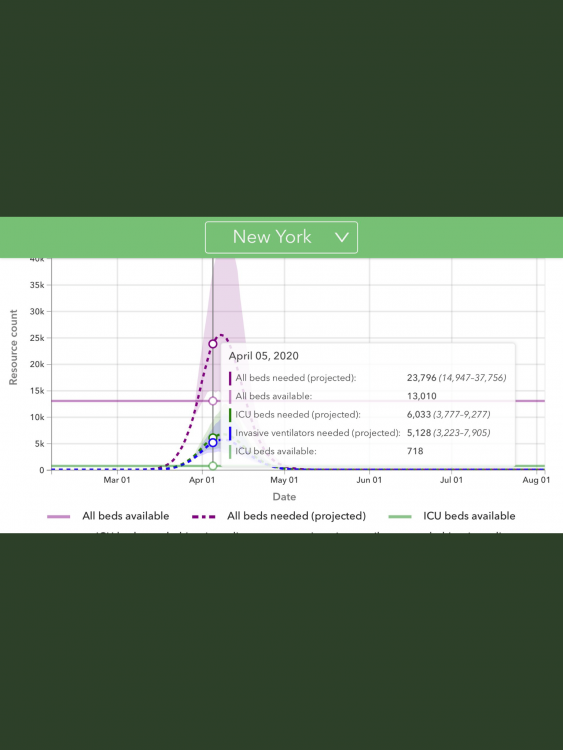
-
Coronavirus Disease (COVID-19)
N is for nowledge replied to suh_fan93's topic in Big Red Lounge: Official BS Forum
Institute for health metrics and evaluation, as part of University of Washington. They are the major model the federal, and local governments have been using to prepare. These are the referenced 1.0, 2.0, and 3.0 models I’ve referenced. -
Coronavirus Disease (COVID-19)
N is for nowledge replied to suh_fan93's topic in Big Red Lounge: Official BS Forum
Why does that matter, the citation is in the friggin graph. Again numbers are numbers. I’m sorry they don’t say what you want them to say. -
Coronavirus Disease (COVID-19)
N is for nowledge replied to suh_fan93's topic in Big Red Lounge: Official BS Forum
I’m saying is it rational to use Italy, and NYC as the starting data set to rollout as a model across the entire USA. Is NYC kind of unique in someways. Is NYC anything like Omaha, Lincoln, or Valantine NE for that matter. im saying it could have been used but was the main trigger presented to potus to close US through April. It’s now been proven pretty overstated, through 2.0 and into 3.0. Yet we are still using it to gauge or response on a federal and local level. Should there not be a better way, a better analysis. -
Coronavirus Disease (COVID-19)
N is for nowledge replied to suh_fan93's topic in Big Red Lounge: Official BS Forum
One numbers are numbers, you don’t need or have an md to review these and engage in critical thinking. I’m sorry you feel that way but I don’t by into the god complex of someone we call dr. btw, it every infectious disease doctor feels this way, but I like the groupthink idea. Literally sourced at the bottom. -
Coronavirus Disease (COVID-19)
N is for nowledge replied to suh_fan93's topic in Big Red Lounge: Official BS Forum
Essentially the model we have been using to model public policy is hot garbage. Based on bad data set from the beginning, 1.0, 2.0, and yes 3.0 are not anywhere close to accurate. The fear of this thing is worse than the reality, again, fatality rate of .4-.7%, and those are with several ore existing conditions. Early on I think we made the right decision to social distance but the end of april signifies a time to ease restrictions. Some have been arguing the model is accurate, I don’t know how, maybe 2+2=5. And that outside of a vaccine stuck in our houses is where you will find us. This started about football in august, some people said we’d still be in our houses sans a vaccine. After April the cure is worse than the virus. -
Coronavirus Disease (COVID-19)
N is for nowledge replied to suh_fan93's topic in Big Red Lounge: Official BS Forum
The idea that a model that has been proven to be anything but accurate is leading our public policy response to this. Ppl may be questioning it but the government continues to push out restrictions and institute health institutions to reduce outpatient and elective surgeries to prep for something that is obvupious won’t be coming. -
Coronavirus Disease (COVID-19)
N is for nowledge replied to suh_fan93's topic in Big Red Lounge: Official BS Forum
See my above point. What changed from 2.0 to 3.0, nothing. Why was 3.0 with nothing changed off substantially on the day it was released. It continues to be incorrect as in not even close., and the variance is growing by the day. -
Coronavirus Disease (COVID-19)
N is for nowledge replied to suh_fan93's topic in Big Red Lounge: Official BS Forum
I didn’t say any social limitations, in fact I’ve said the exact opposite citing my own families behavior. I’ve questioned for how long this is necessary. Recall the initial goal. To flatten the curve, don’t overburden the health care system. Well we are furloughing health care staff across the country, hospitals are empty based on a model that continues to dissolve in accuracy if it ever had any. This SD was never to eradicate the virus or stop all new cases. People will get this virus for quite some time be treated and hopefully recover. The idea that you are going to shut down/SD with each and every new case was....1) not initial goal. 2) completely unrealistic for a virus with a fatality rate of .4-.7%. death always lags based on Fauci and birx. Any death is horrible. This is not an either or. I don’t need an MD to look at numbers and see any model that has accuracy of 30-40% shouldn’t be followed like the Bible to make large public policy decisions. Yes dr fauci was on tv many times saying covid wasn’t going to be an issue here. Saying it wasn’t widespread. As late as late January. That’s the expert you were talking about right. -
Coronavirus Disease (COVID-19)
N is for nowledge replied to suh_fan93's topic in Big Red Lounge: Official BS Forum
Just what I thought it wasn’t that the elite “experts” could have possibly been wrong, it’s because social distancing had such a dramatic affect. Let’s say I agree with that, which I don’t, why the significant discrepancy from 2.0 to 3.0. Why is 3.0 also off significantly just 2 days into the 3.0 model. 2.0 to 3.0 social distancing didn’t change at all....and absolutely zero has changed to skew the “model” over the last on another note, is using model that even an “accurate” one based on your observations, is only 30-40% accurate projected vs actual. Should we really be leaning on it to make major decisions or policy. Like um closing the country. -
Coronavirus Disease (COVID-19)
N is for nowledge replied to suh_fan93's topic in Big Red Lounge: Official BS Forum
If people are scared of this disease than they’ve literally talked themselves into a hysteria that shouldn’t exist and should start looking at additional sources for information. It is still believed that the fatality is somewhere between .4-.7% with the majority of those being in people with advanced age or several comorbidities. ppe is coming and people should get. My point is it’s all a ripple affect. People don’t work in a bubble and more pay might be available if demand was larger. It’s not just about truck drivers or health care workers, that contrary to the narrative, are being layed off and furloughed in waves. -
Coronavirus Disease (COVID-19)
N is for nowledge replied to suh_fan93's topic in Big Red Lounge: Official BS Forum
Again. 2.0 isn’t valid anymore we are on 3.0 which cdc director already said is inflated. No, 2.0 and 3.0 nothing has changed except for actual data being used instead of using NYC and Italy across the entire nation. Social distancing was already accounted for in 2.0 and same measures in 3.0. Only change is actuals from domestic results. 3.0 just updated on Sunday is already off significantly, see attached chart I posted just before this. This is GOOD news and don’t understand the dunking saying otherwise. I’m still not sure how anyone defends the models as “accurate” when they’re anything but. Even Fauci and birx have backed away saying they’re only as good as the “assumptions” made. Is this kind of like a magic 8 ball? -
Coronavirus Disease (COVID-19)
N is for nowledge replied to suh_fan93's topic in Big Red Lounge: Official BS Forum
Yep totally legit. Nothing to see here, just accurate “models” proven inaccurate by the day and by the hour. Btw, all the models built in social distancing measures taken since early to mid March.